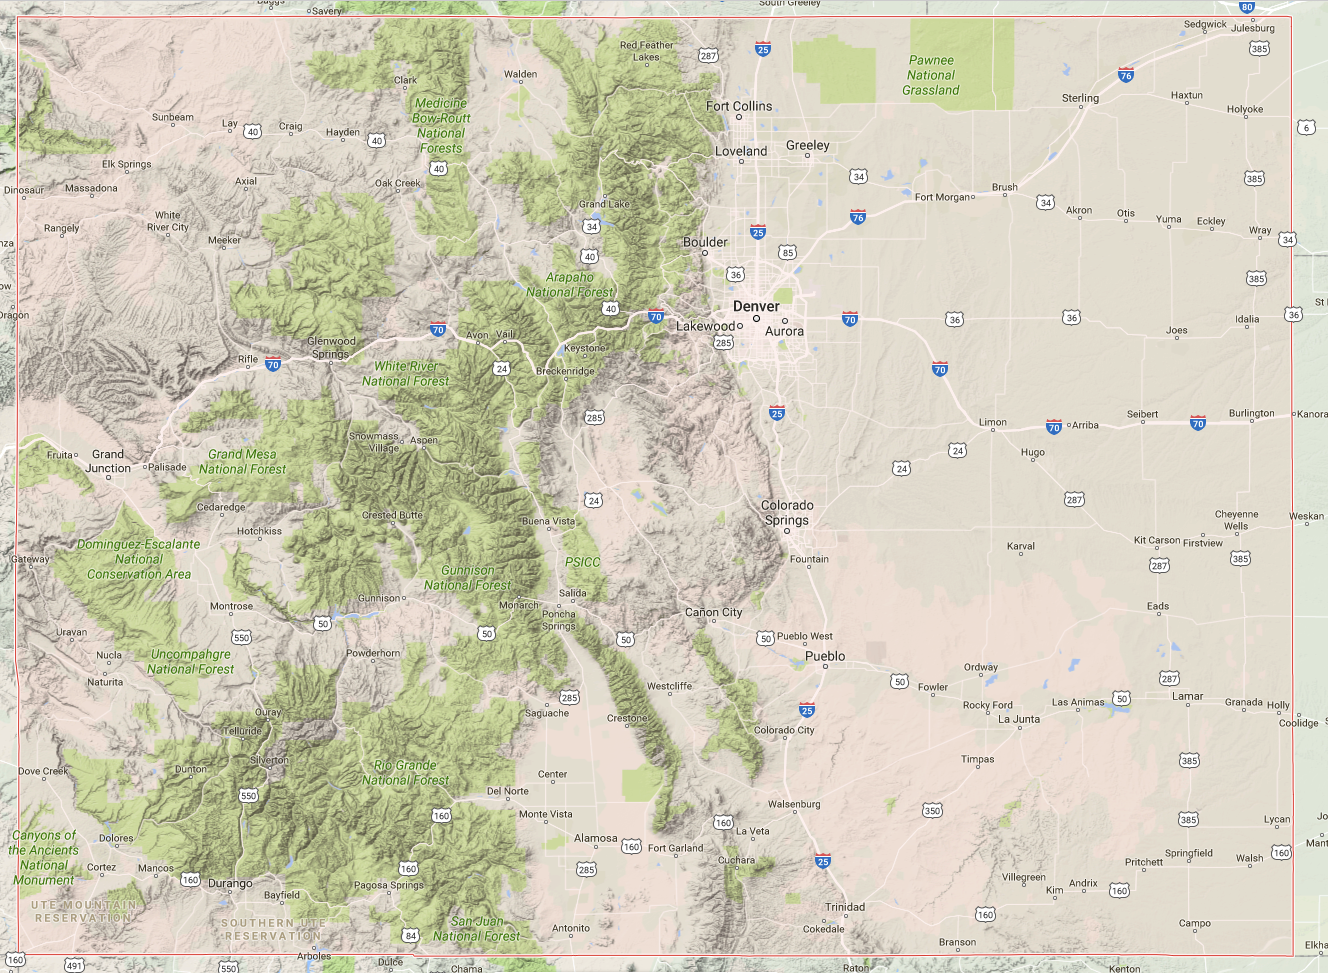
Below is a table with temperatures for various stations around the state. For each station you'll find their all-time record maximum high temperature and all-time record minimum low temperature. Make a map of record high temperatures, and another map for record low temperatures.
| Station Name | Record High | Record Low |
|---|---|---|
| Akron | 107°F | -32°F |
| Alamosa | 96°F | -50°F |
| Boulder | 104°F | -33°F |
| Burlington | 112°F | -25°F |
| Colorado Springs | 101°F | -27°F |
| Cortez | 102°F | -31°F |
| Denver | 104°F | -25°F |
| Fort Collins | 103°F | -41°F |
| Grand Junction | 106°F | -23°F |
| Grand Lake | 92°F | -43°F |
| Lamar | 111°F | -30°F |
| Pueblo | 109°F | -28°F |
| Steamboat Springs | 100°F | -54°F |
| Telluride | 96°F | -36°F |
| Walden | 94°F | -48°F |
| Walsh | 108°F | -25°F |
Now it's time to plot these temperatures on a map! Right click on the map below to save it (or click and drag it to your desktop). Or you can use a Colorado map of your own. One final option (if you're old school!) is to draw a large square on a blank sheet of paper and pretend the square is Colorado.

With your favorite image editing software (or crayons/pencils), add open circles where each station is located. If you're not sure where a station is, and can't see it notated on your map, you can search for it on Google Maps.
Let's color the circles based on the temperature value for that station. Use the below lists as a legend for your record high map and your record low map.
Voila! You should have two maps showing regional differences in record temperatures across the state of Colorado. Notice any interesting patterns? Anything surprising to you? If you find this interesting, check out temperature records for other stations and add those to the map. You can find temperature records on our website at the bottom of our Extremes Page.
Record Low Temperatures Map