Precipitation
Precipitation
|
| The images above use daily precipitation statistics from NWS COOP, CoCoRaHS, and CoAgMet stations. From top to bottom, and left to right: most recent 7-days of accumulated precipitation in inches; current month-to-date accumulated precipitation in inches; last month's precipitation as a percent of average; water-year-to-date precipitation as a percent of average. |
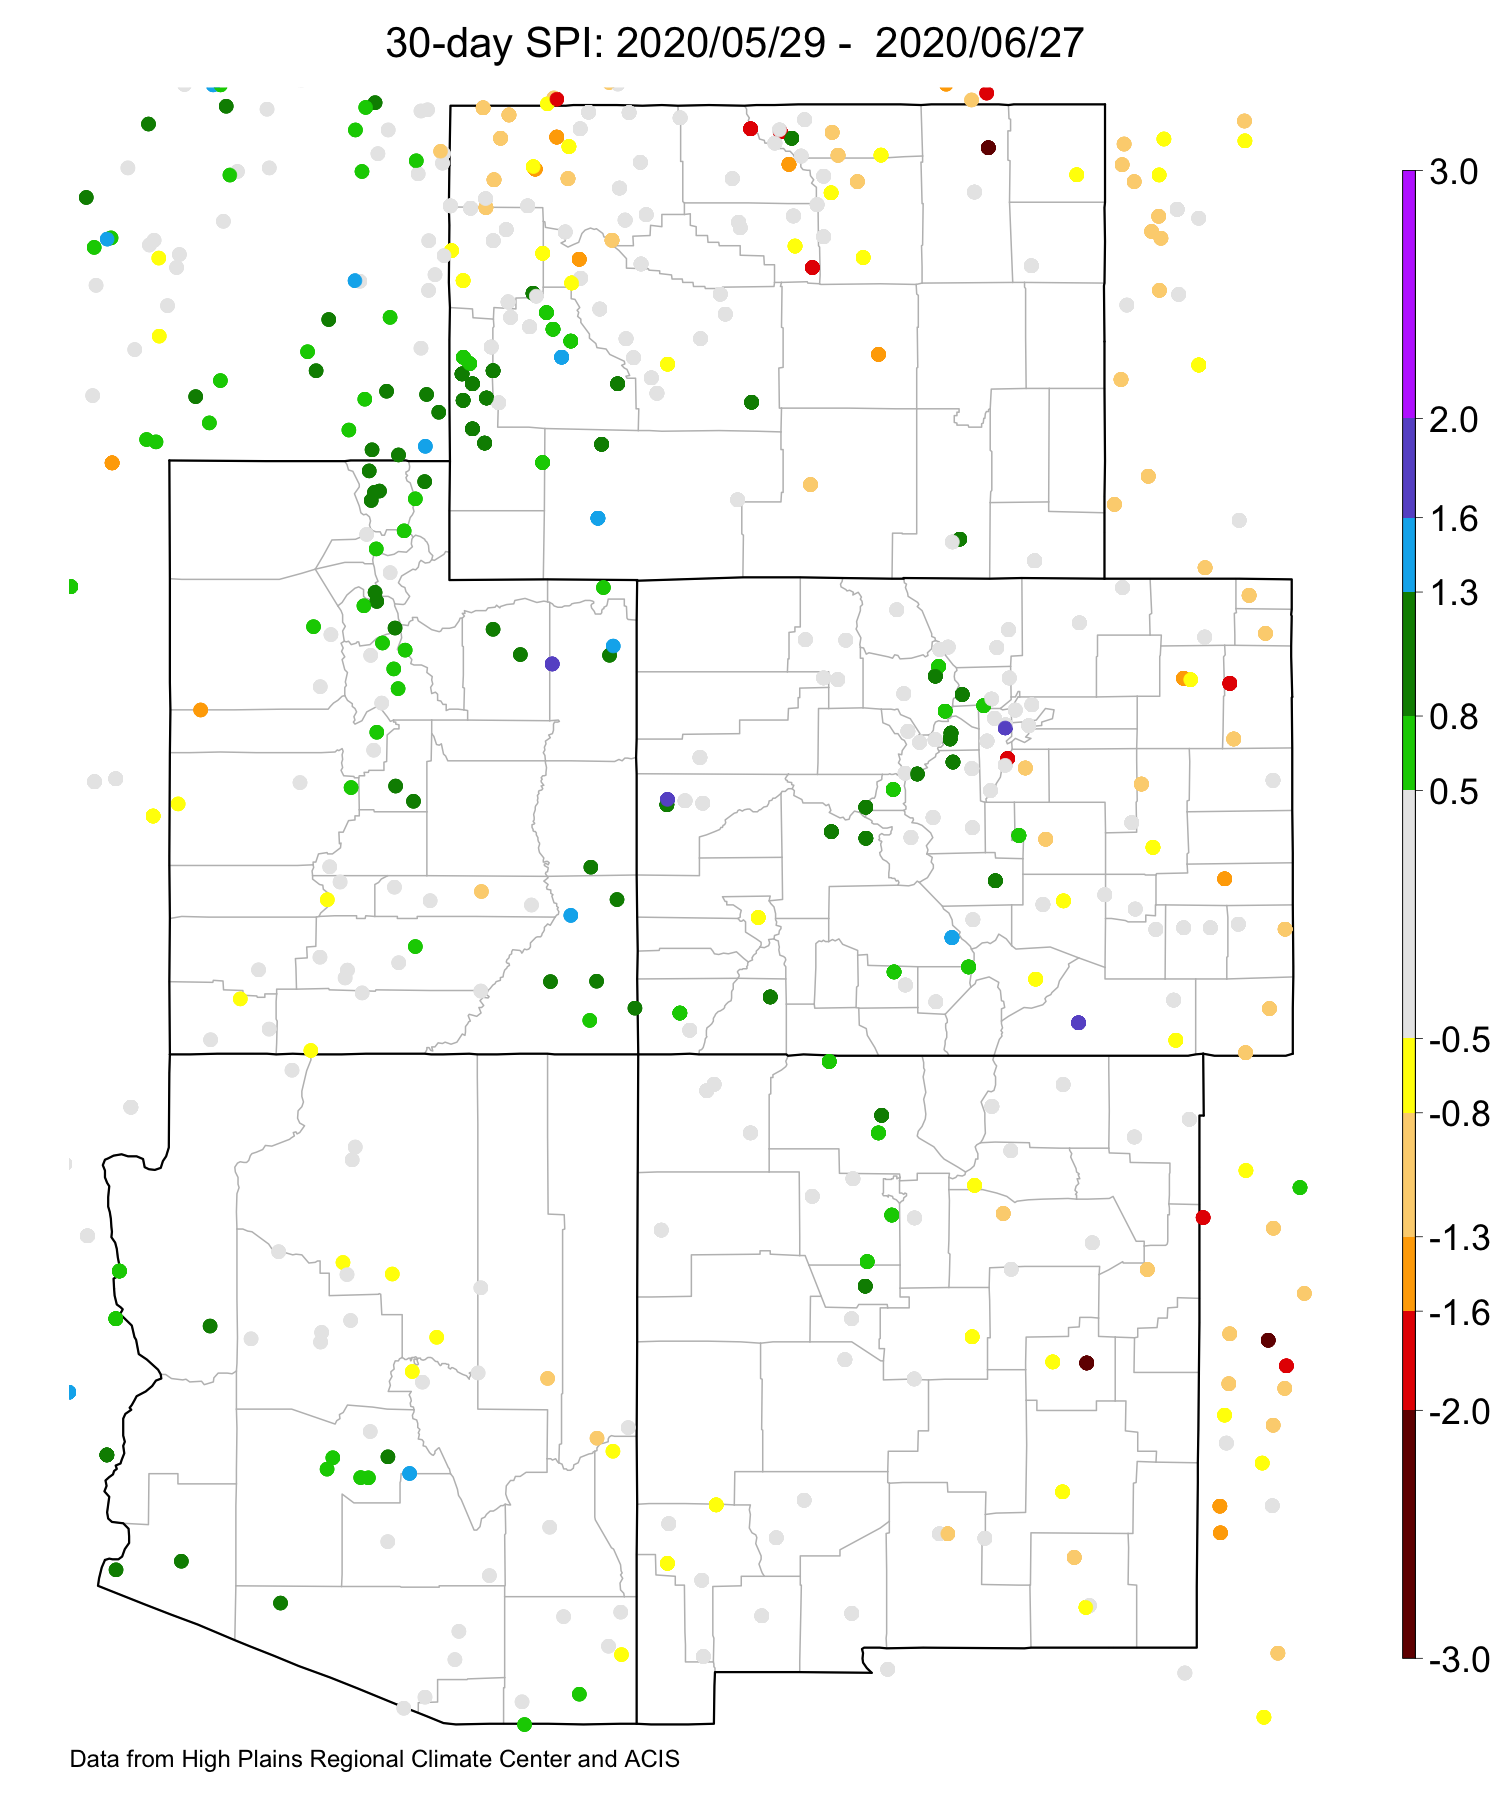
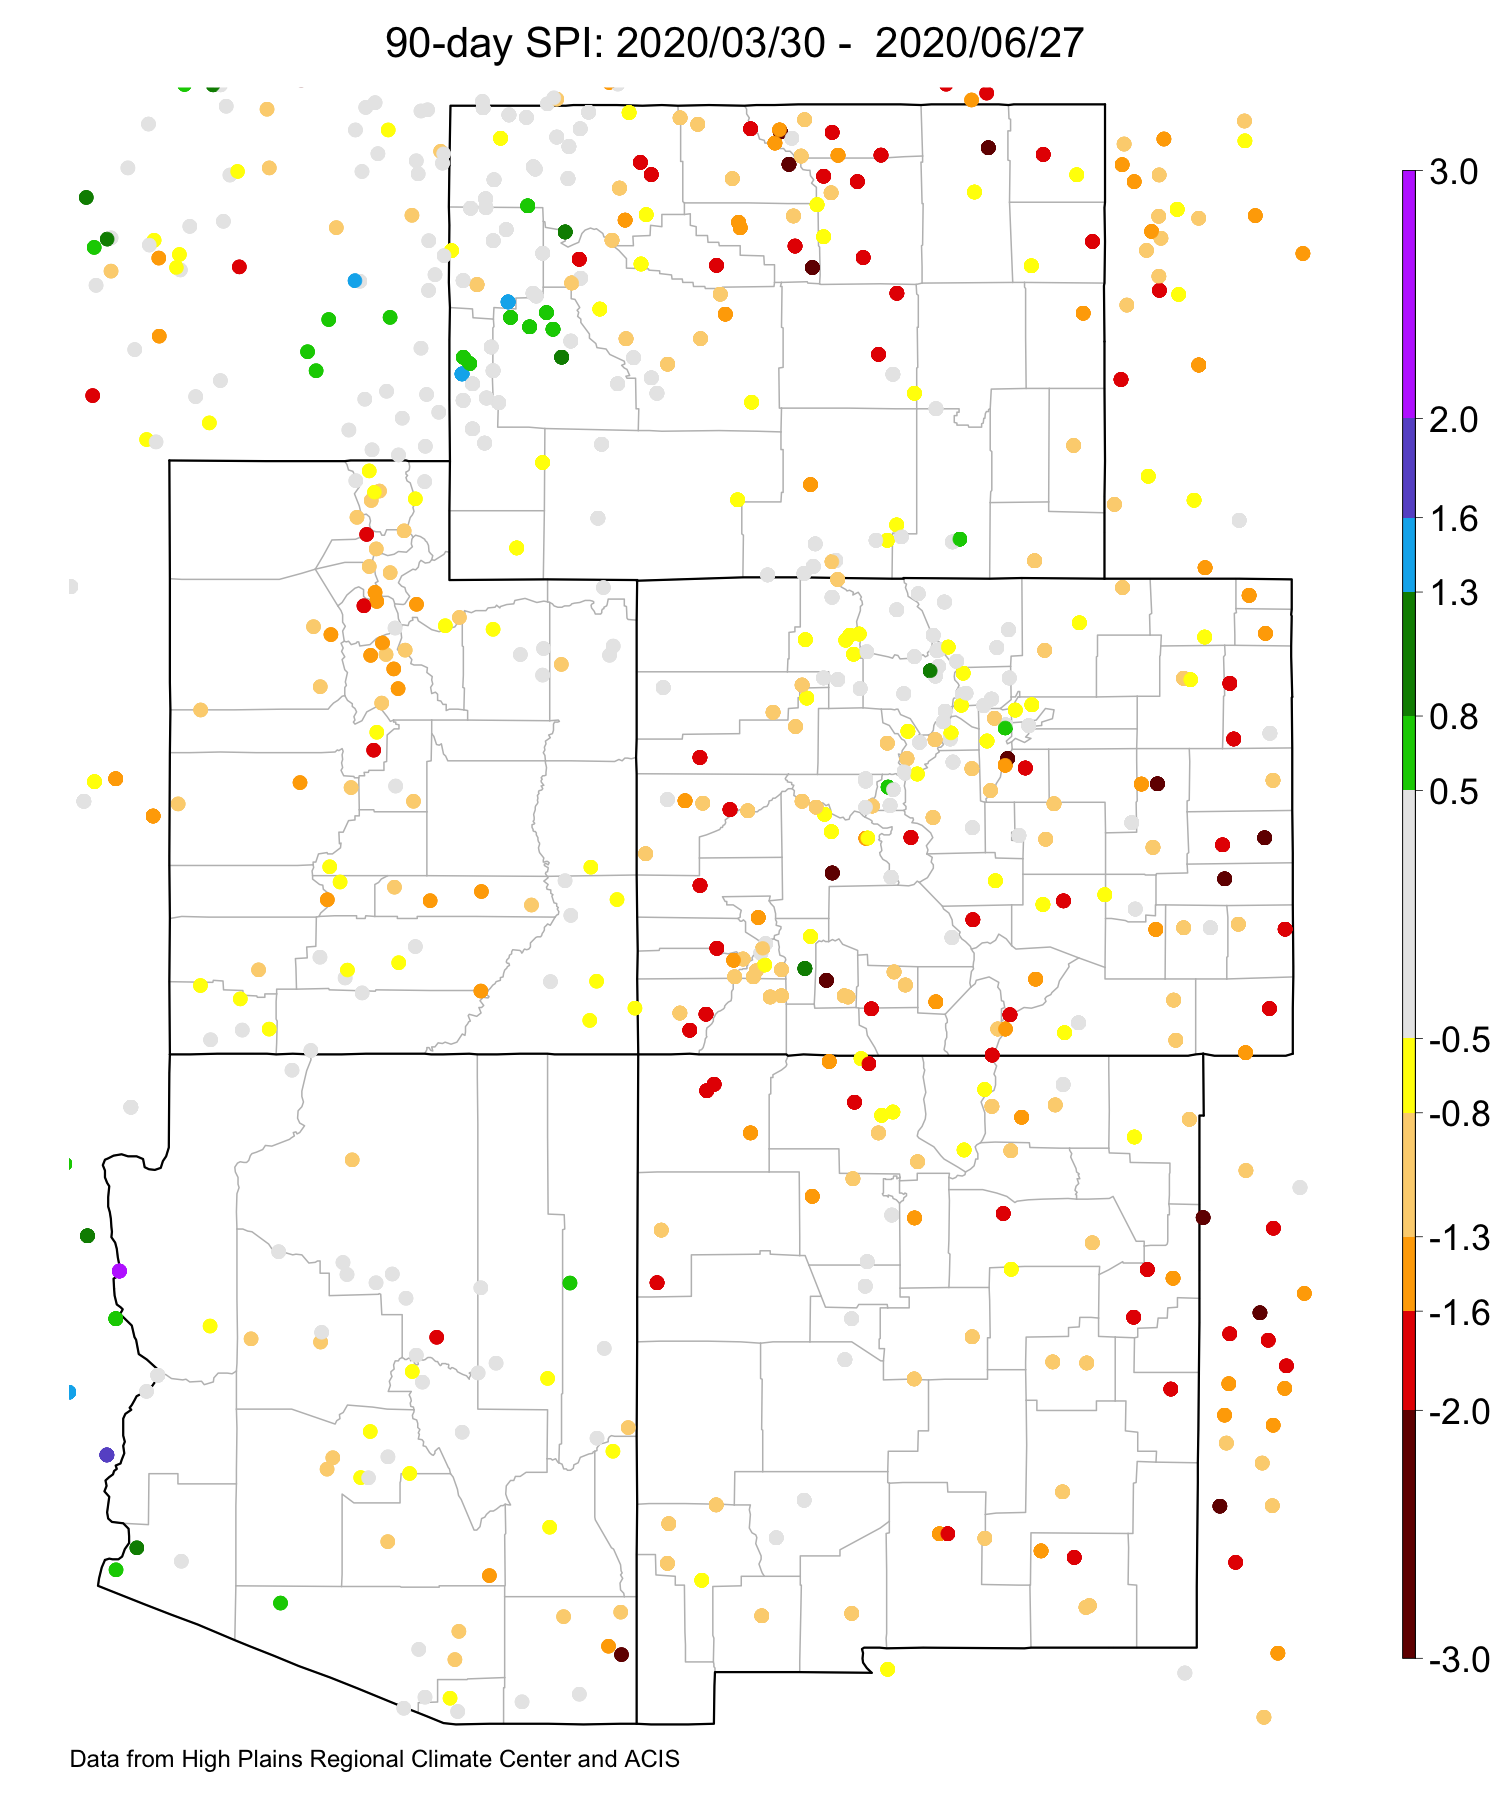
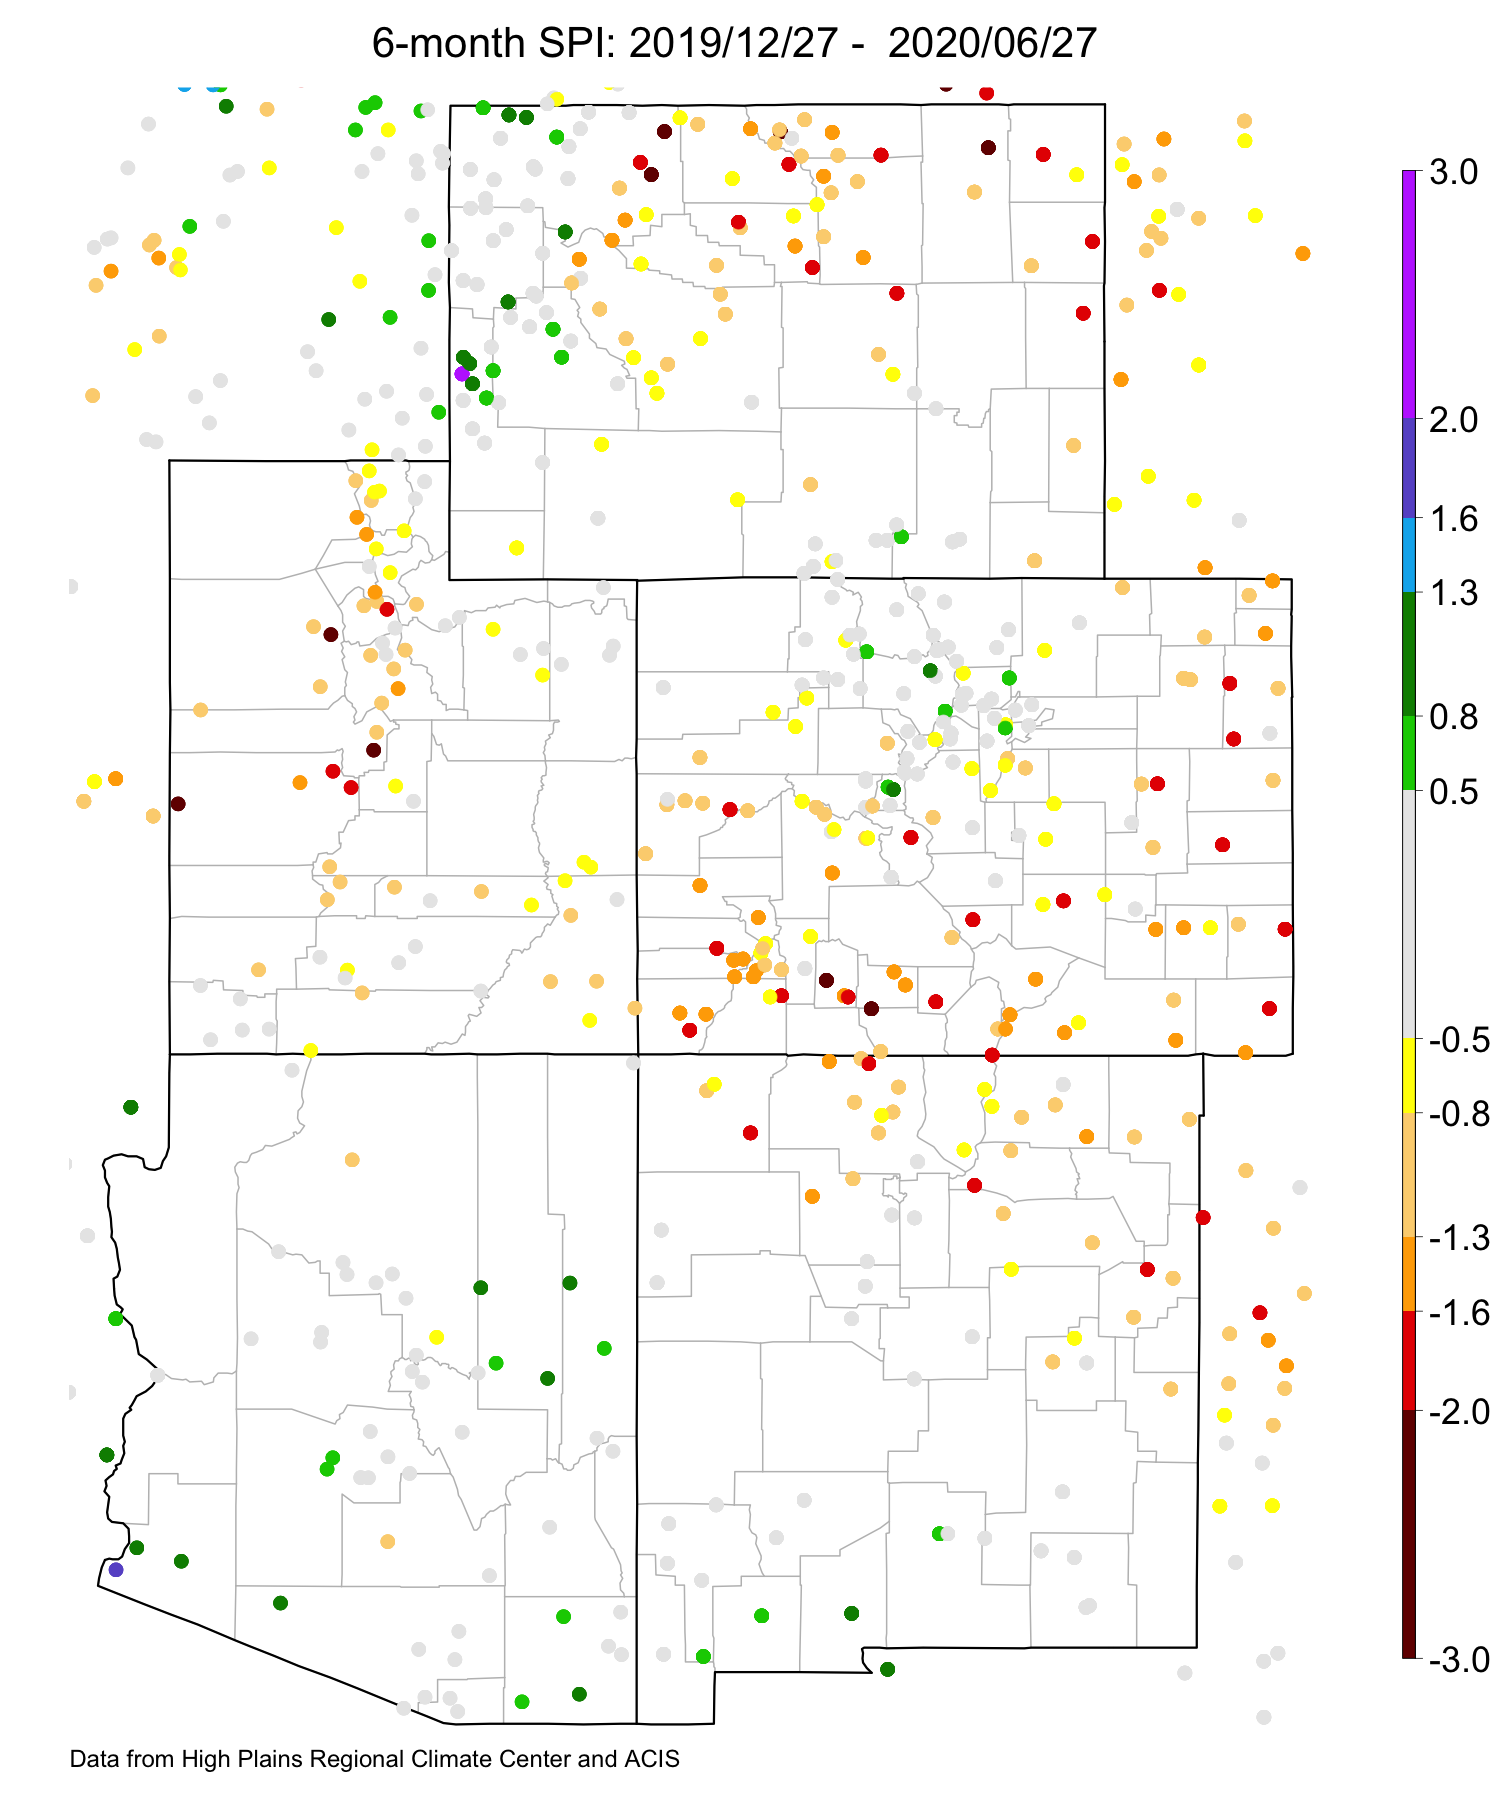
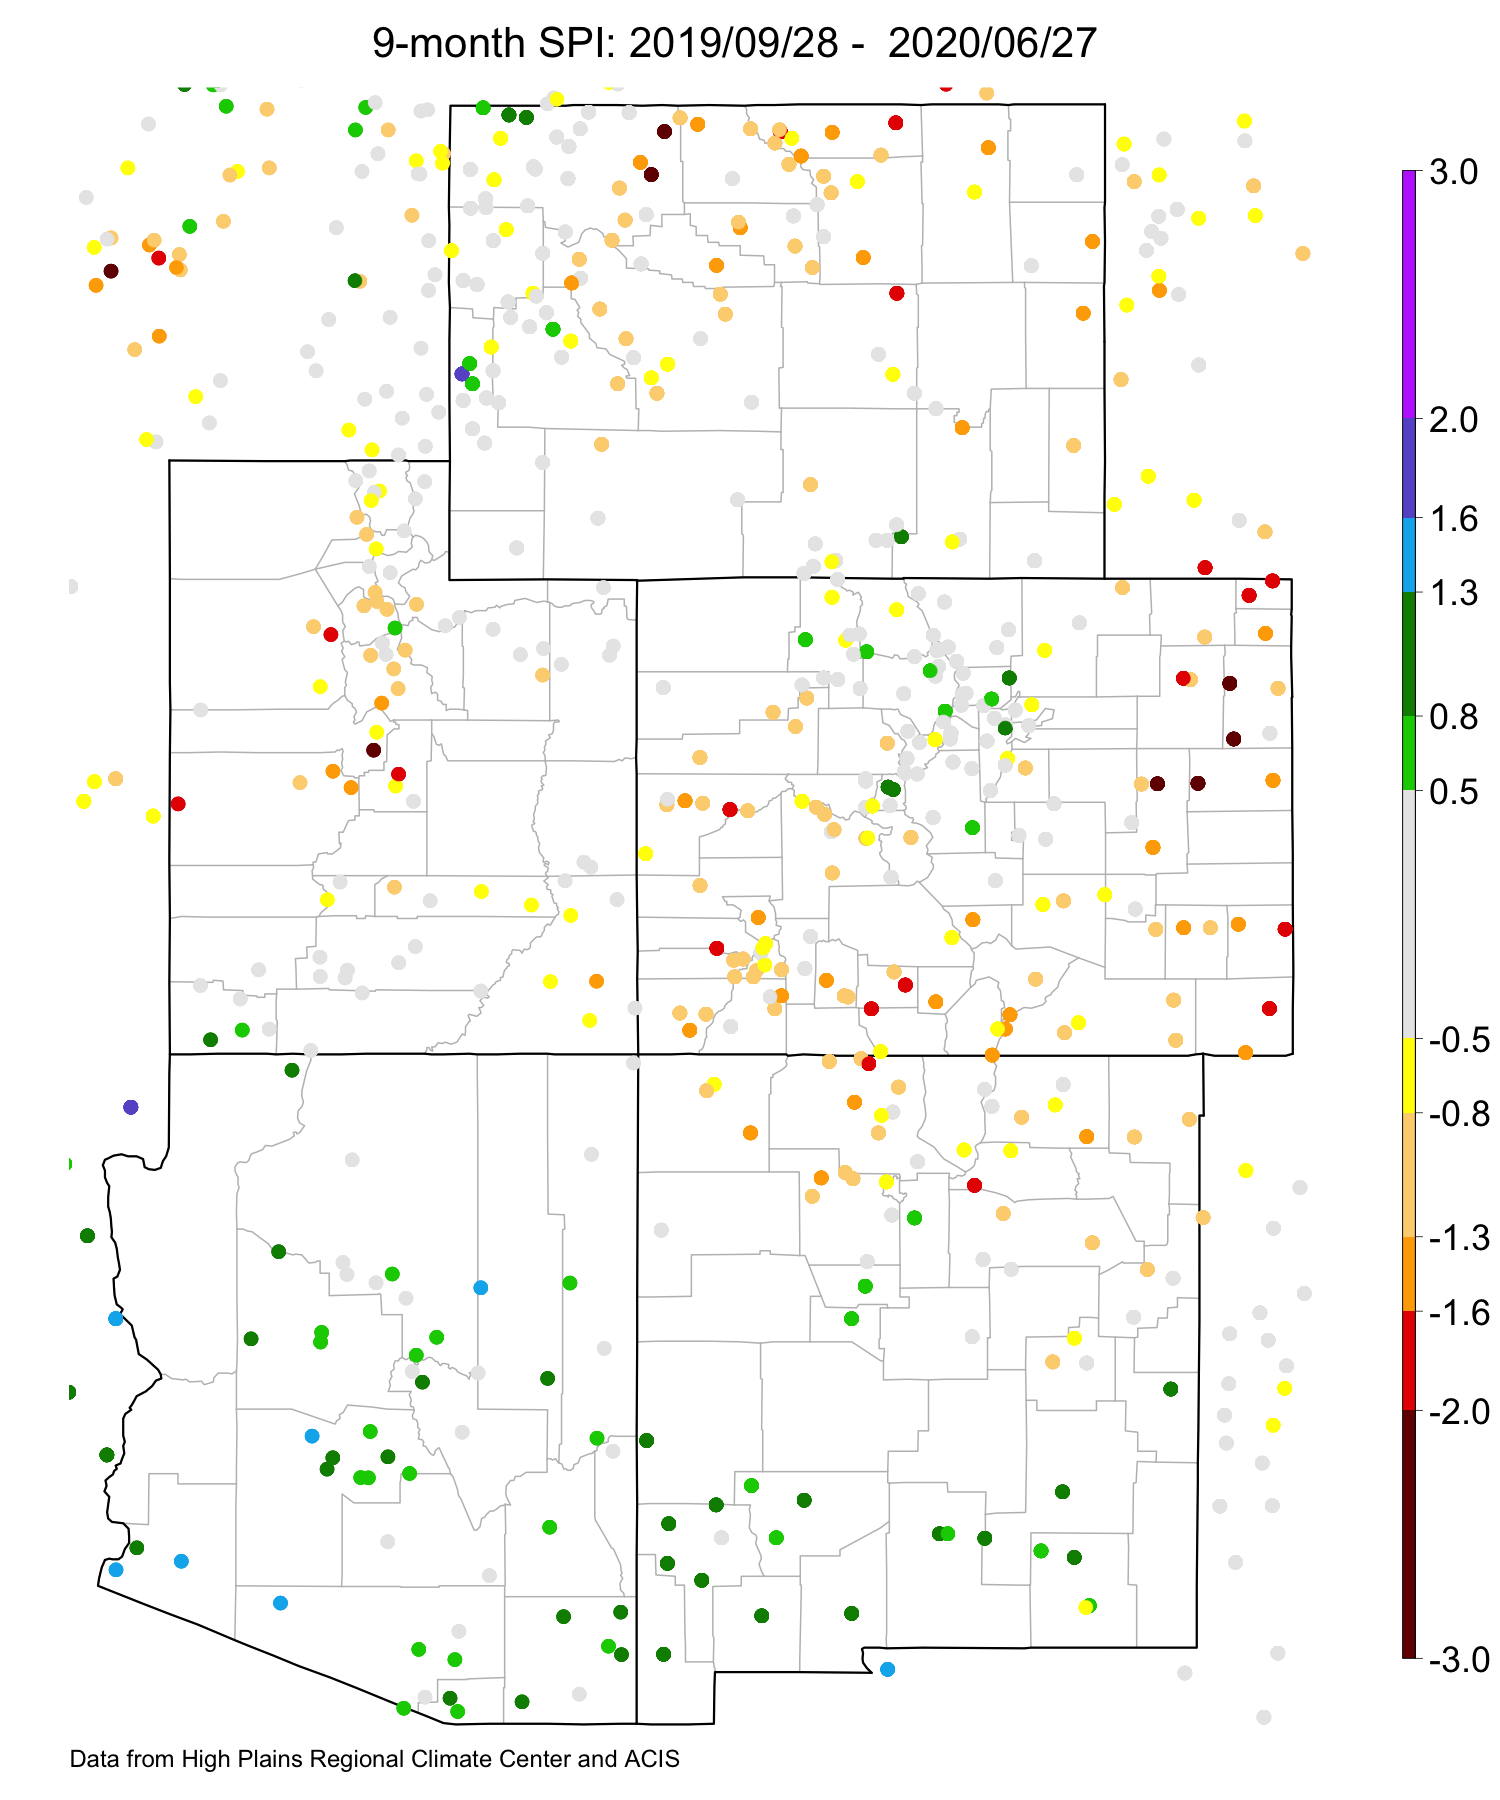
| Standardized Precipitation Index standardizes precipitation accumulations for a specified time period into percentile rankings. Colors match the different drought categories with the U.S. Drought Monitor. 30- and 60-day SPIs focus on short-term conditions while 6- and 9-month SPIs focus on long-term conditions. SPI data provided by High Plains Regional Climate Center. |
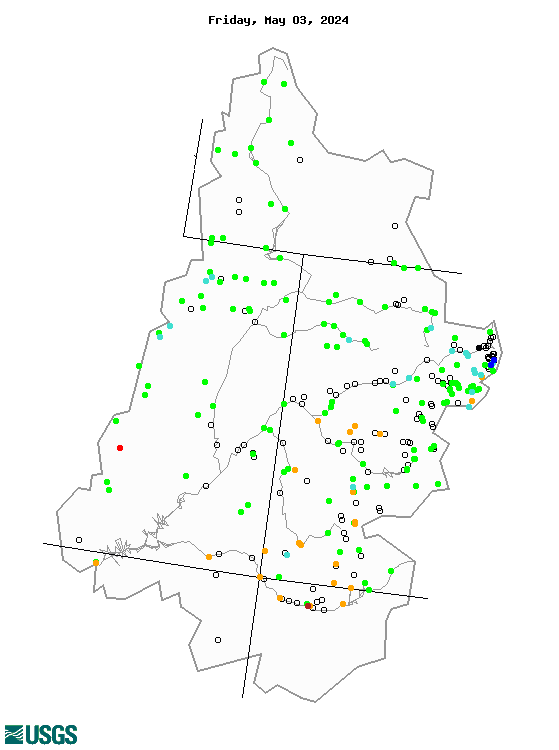
| The top left image shows 7-day averaged streamflows as a percentile ranking across the UCRB. The top right image shows 7-day averaged discharge over time at three key sites around the UCRB: The Colorado River at the CO-UT state line; the Green River at Green River, UT; and the San Juan River near Bluff, UT. All streamflow data provided by United States Geological Survey. |

| The top left image shows VIC modeled soil moisture as a percentile ranking. The top right image shows satellite-derived vegetation from the VegDRI product (which updates on Mondays). |
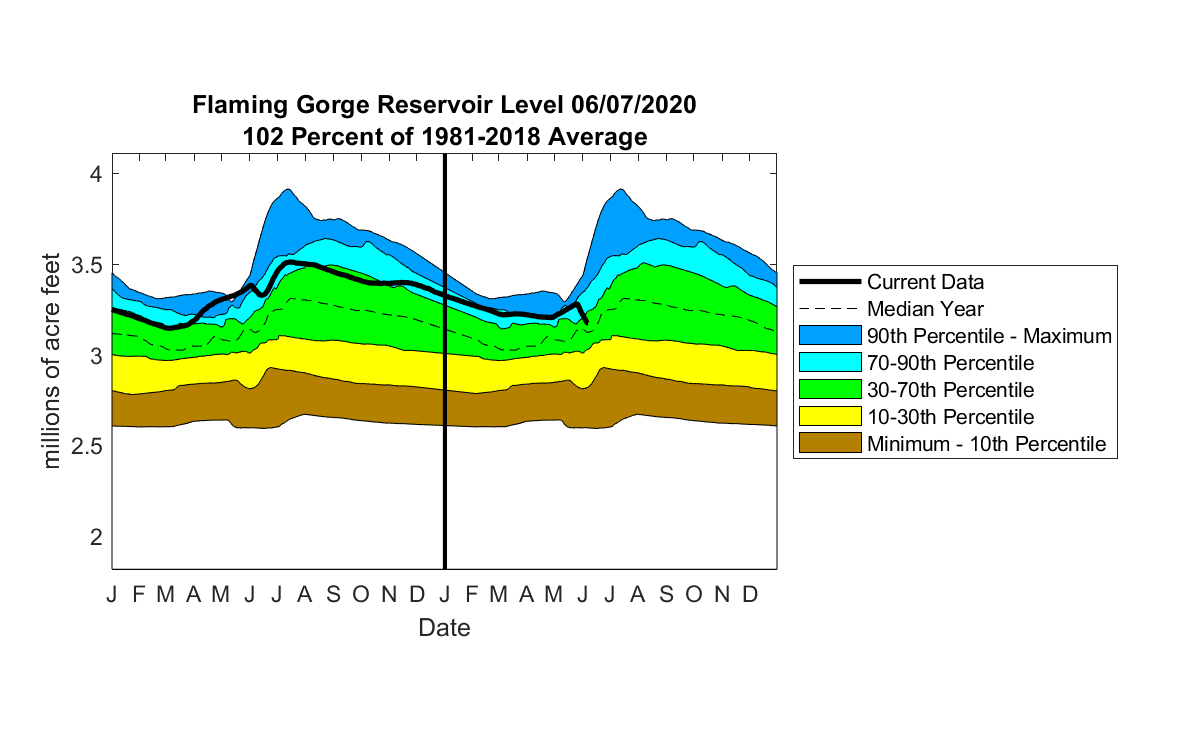
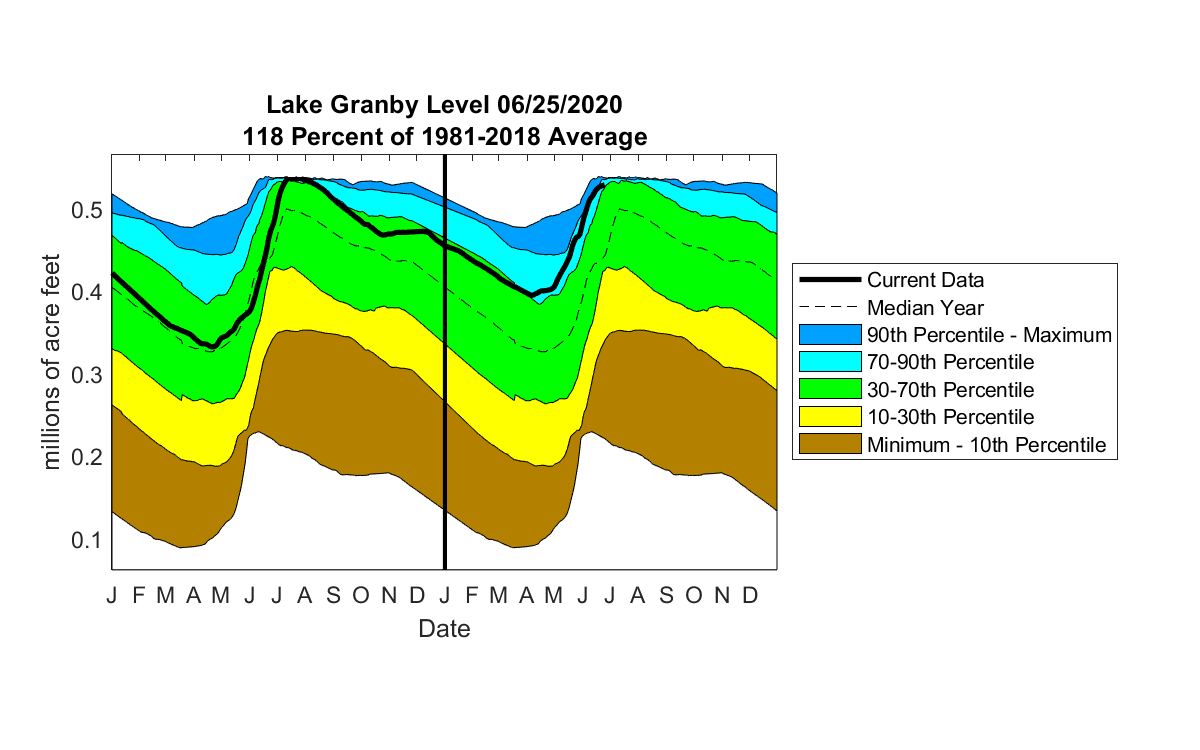
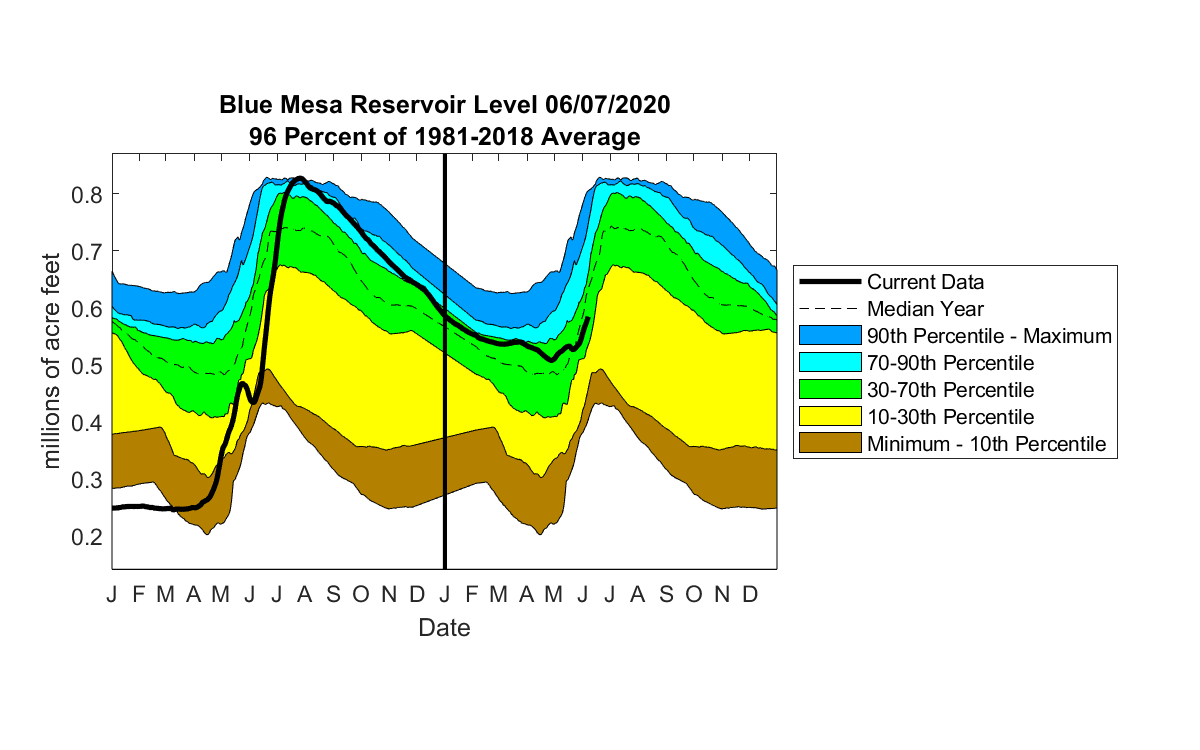
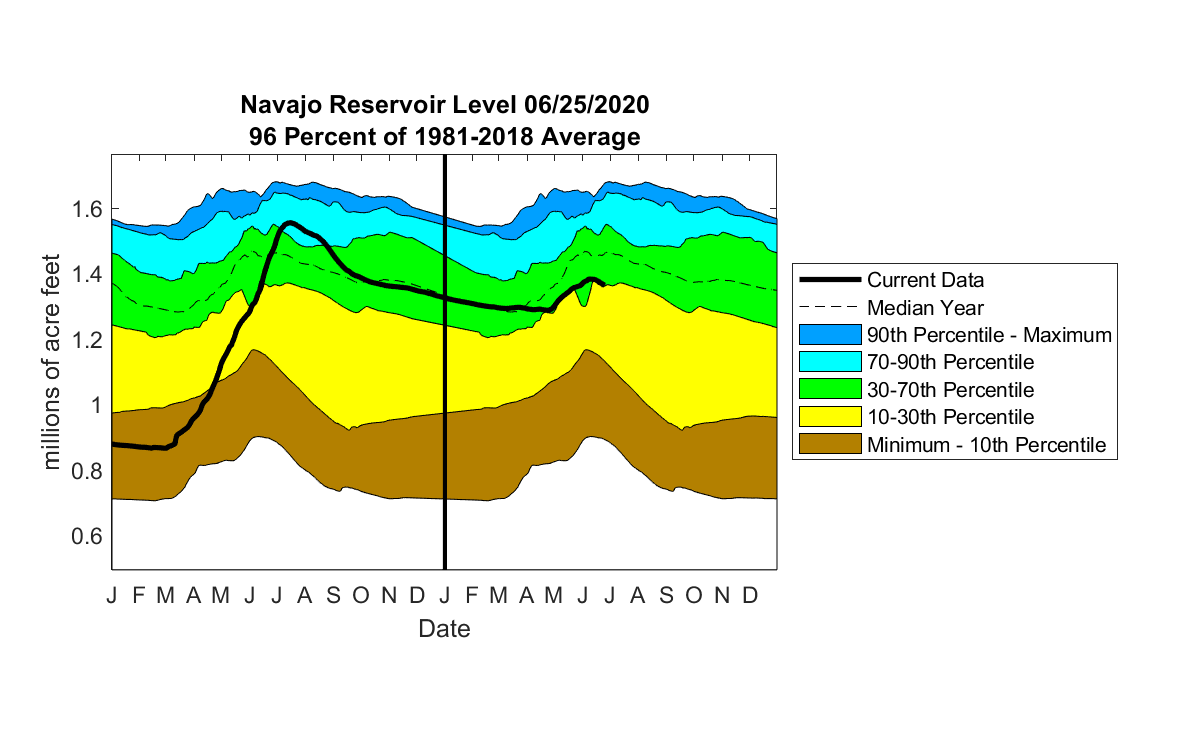
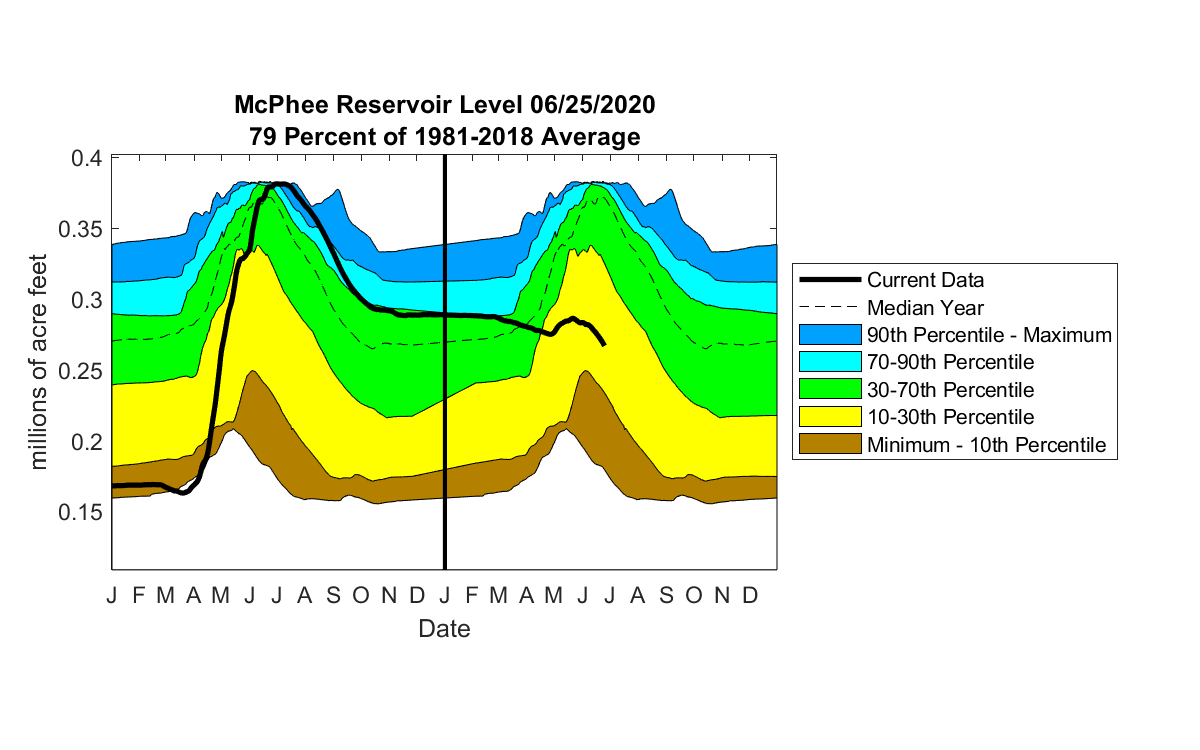
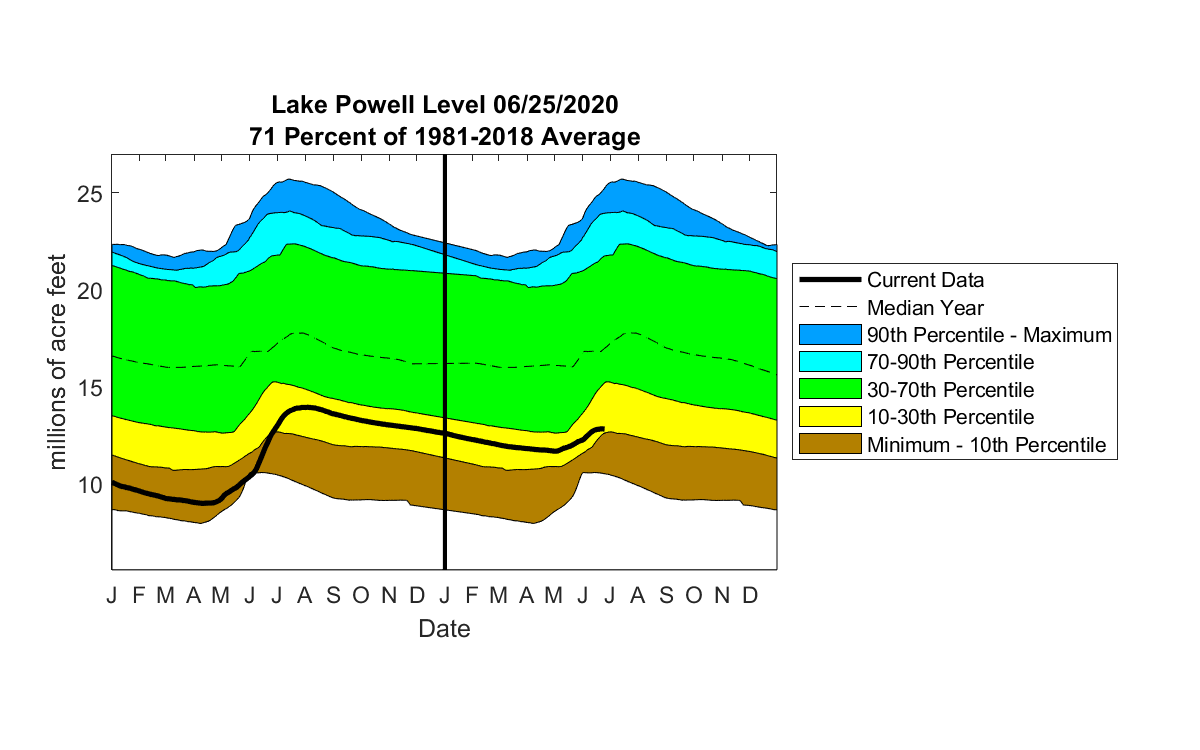
The graphs shown below are plots of reservoir volumes over the past full year and current year to date (black). The dashed line at the top of each graphic indicates the reservoir's capacity, and the background color-coded shading provides context for the range of reservoir levels observed over the past 30 years. The data are obtained from the Bureau of Reclamation. Some of the reservoir percentiles don't line up at the new year due to differences in reservoir levels at the beginning of 1985 and the end of 2014. Dead storage has been subtracted. Note: Lake Granby data are obtained from the Colorado Division of Water Resources, and only goes back to the year 2000.
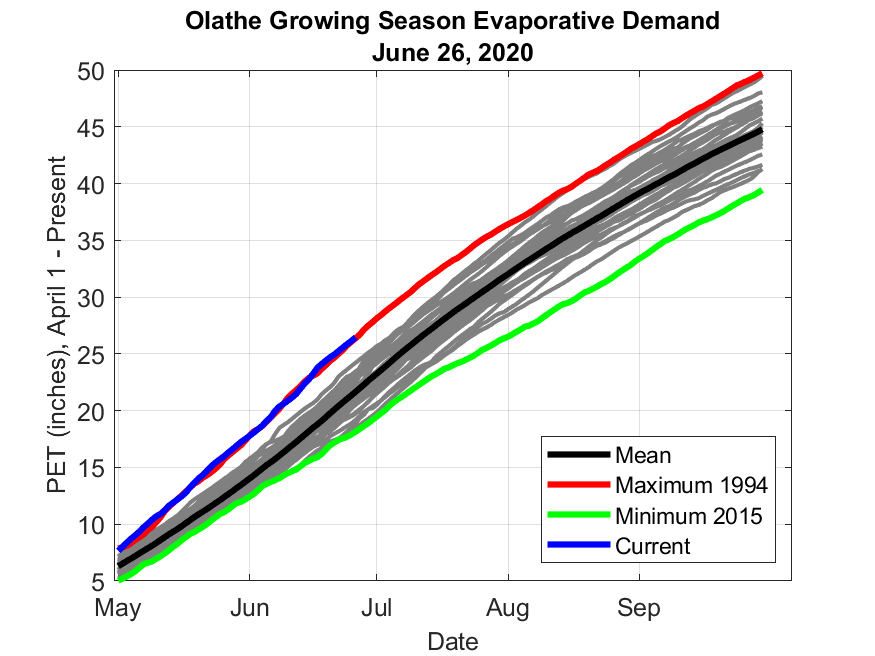
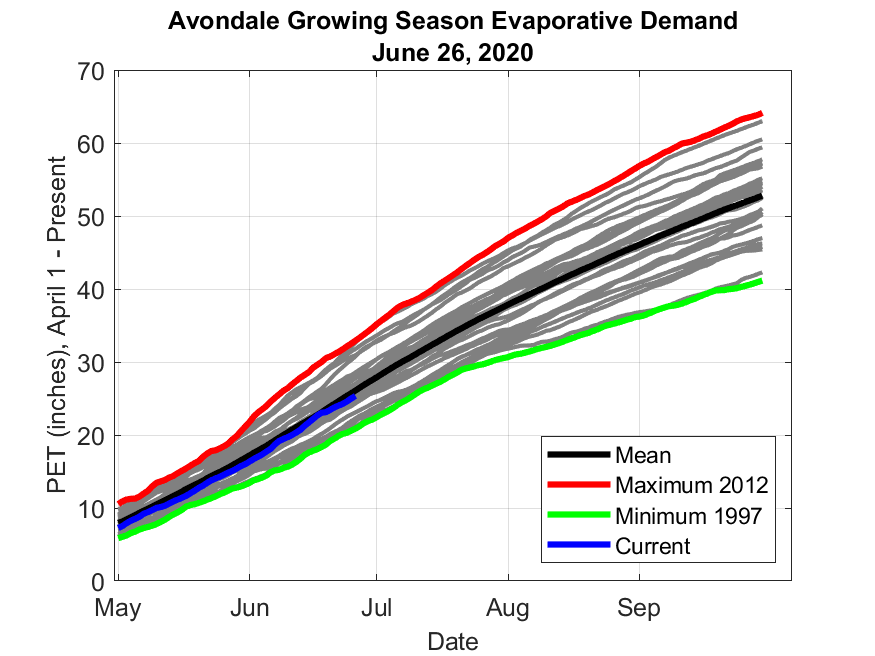
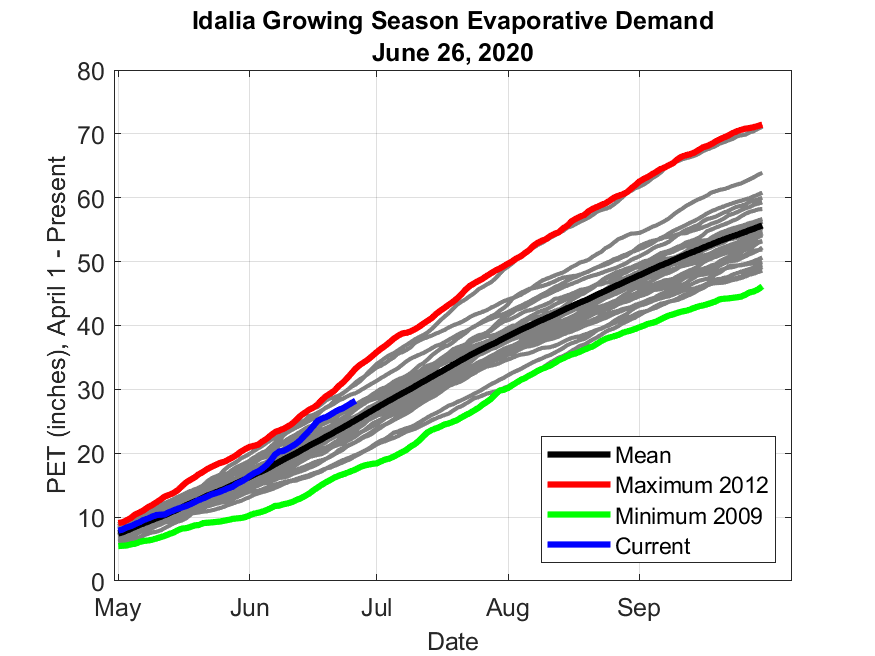
 The above images are of reference evapotranspiration (ET) from CoAgMET sites across Colorado. Reference ET assumes
the amount of water that will evaporate from a well-irrigated crop. Higher ET rates occur during hot, dry, and
windy conditions. Lower ET rates are more desirable for crops. See a map of locations for the above ET
sites.
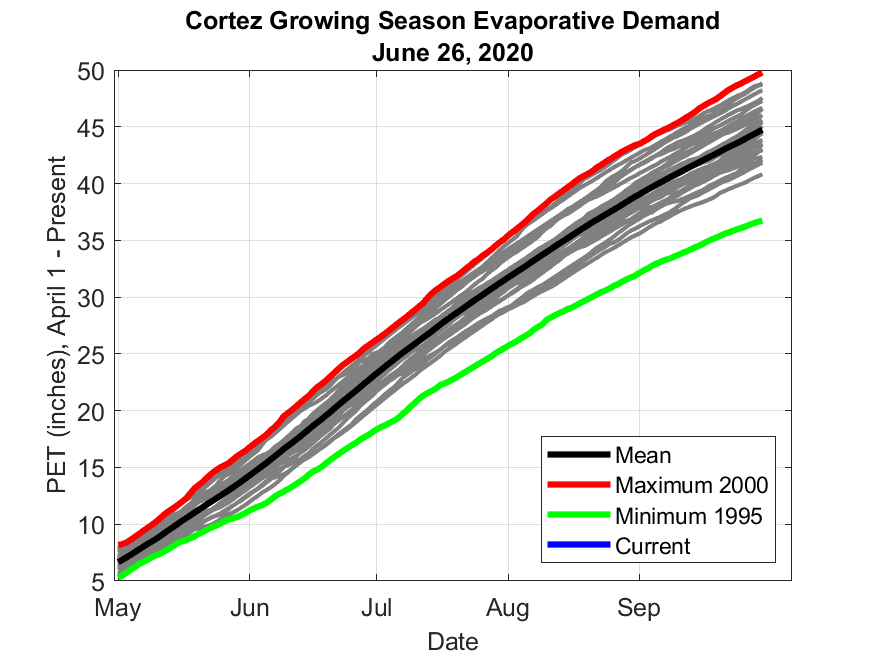
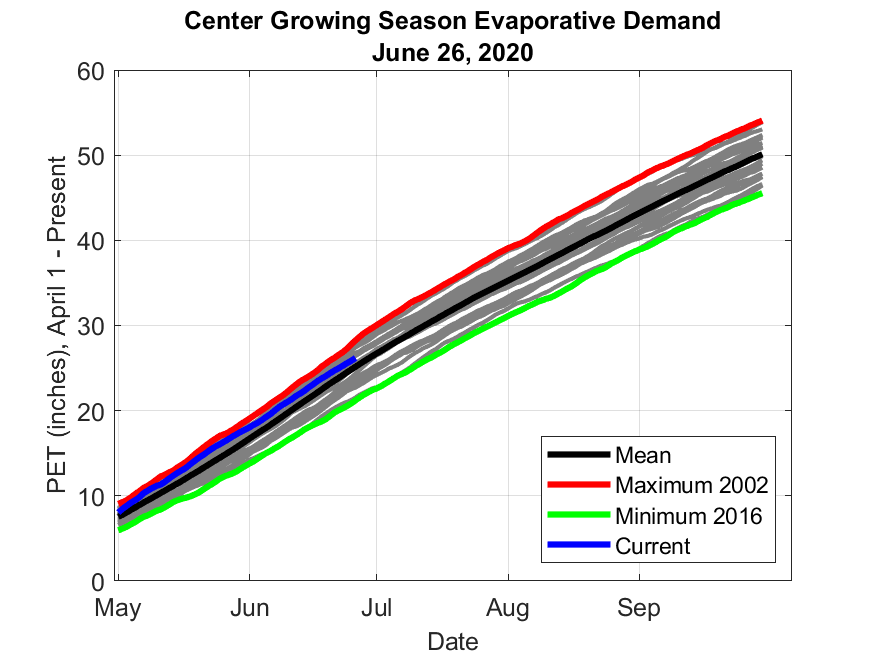
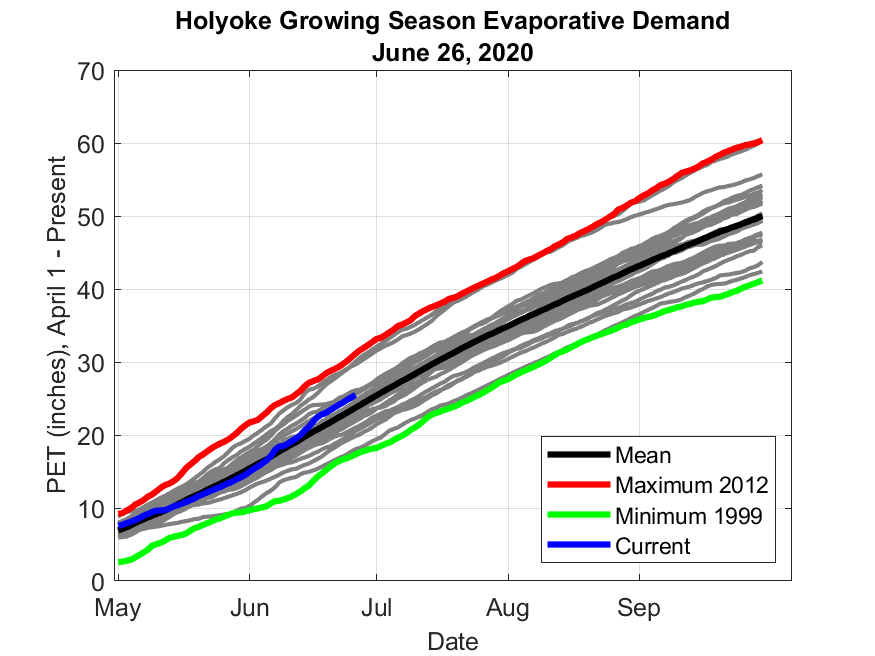
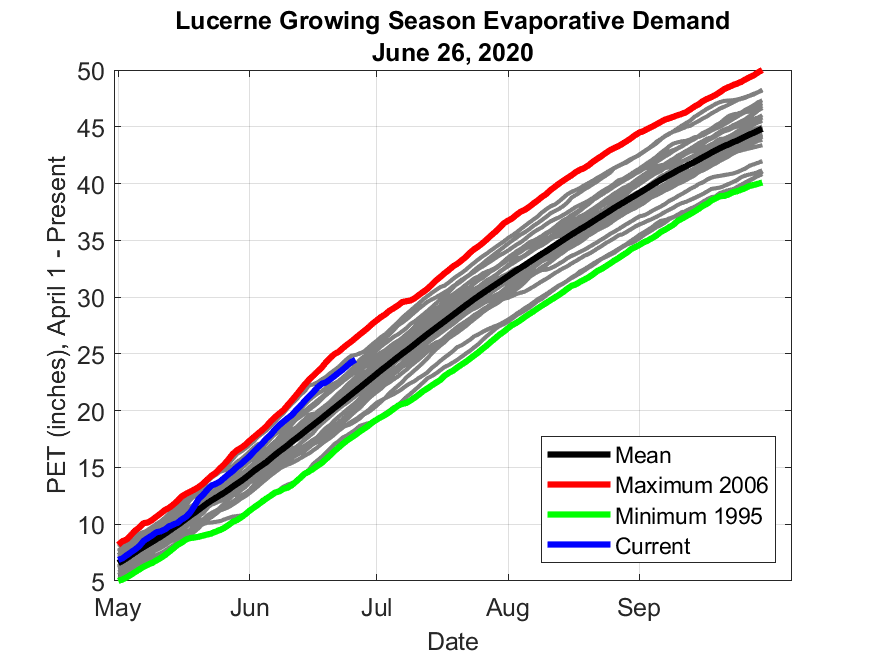
The above images are of reference evapotranspiration (ET) from CoAgMET sites across Colorado. Reference ET assumes
the amount of water that will evaporate from a well-irrigated crop. Higher ET rates occur during hot, dry, and
windy conditions. Lower ET rates are more desirable for crops. See a map of locations for the above ET
sites.
|

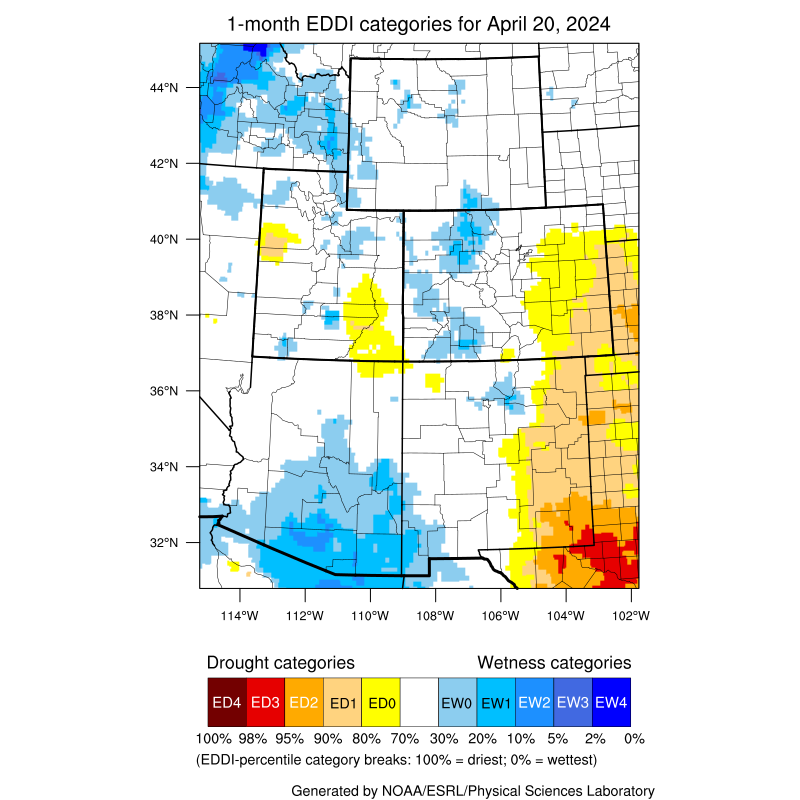

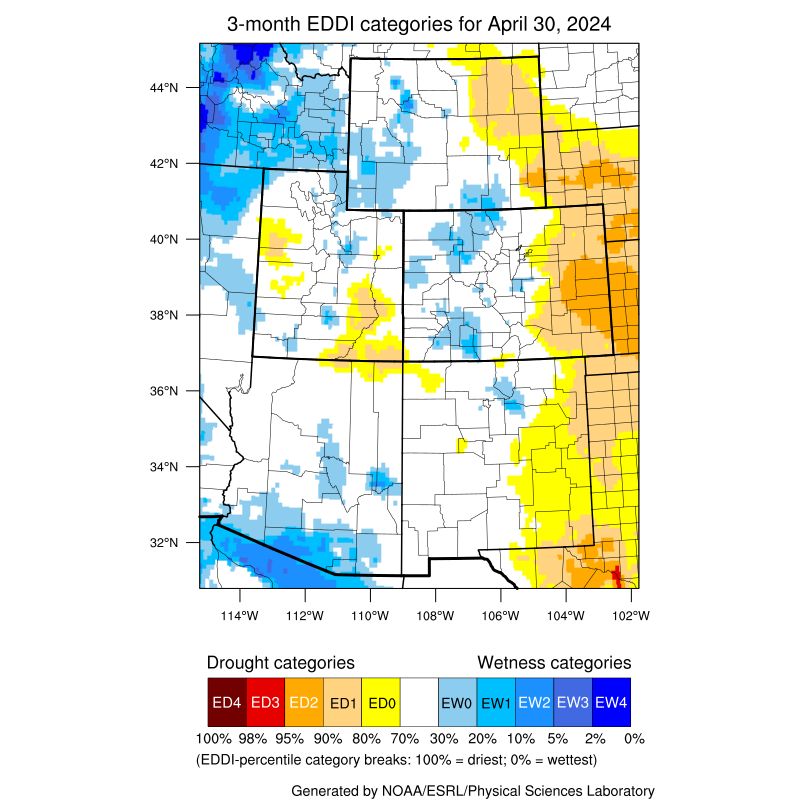
| The above images are available courtesy of NOAA’s Evaporative Demand Drought Index (EDDI). Drought classification listed is a function of the depth of reference evapotranspiration accumulated over a given period of record with respect to a climatology of 1981-2010. The drought categories displayed are in line with the US Drought Monitor's Percentile Ranking Scheme. Data used to generate these maps come from the North American Land Data Assimilation System Phase-2 (NLDAS-2) project, which assimilates observations of temperature, wind speed, radiation, and vapor pressure deficit. The date indicates the last day of the period of record, and the week number indicates the window size for the period of record. |


| All images show temperature departures from average over different time periods (last 7 days on top left; month-to-date on top right; last full month on bottom). Temperature departure maps provided by HPRCC ACIS. |

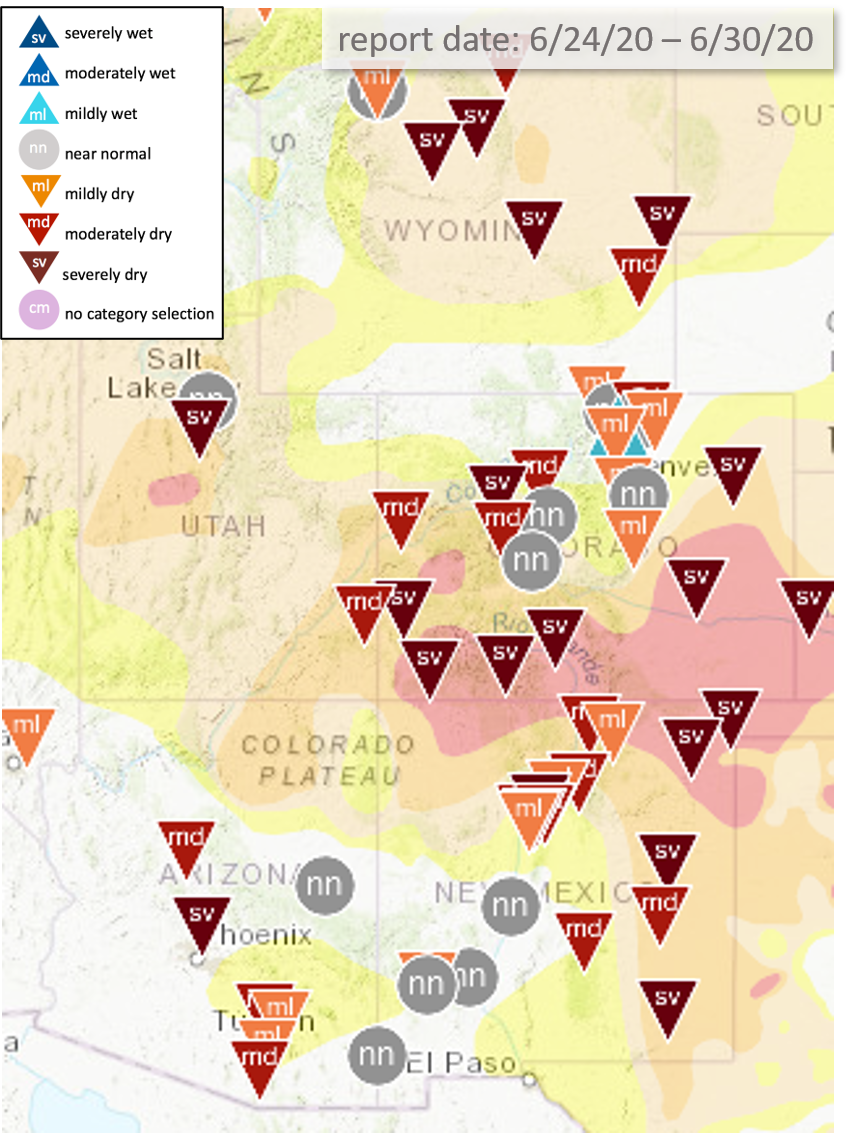
Map of current condition monitoring reports submitted to CoCoRaHS in the last week overlaid on the current U.S. Drought Monitor depiction. Specific impacts reports from local experts listed below.
Utah:
Millard County is very dry with numerous fires. Range conditions in central Utah are very poor.
Colorado:
Southeast CO: It looks like the middle of winter, there is no green and everything, even native grasses and weeds are not growing. Any moisture that falls is immediately zapped by high temperatures and winds. Due to a short spring, grasshoppers were about a month late. Rocky Ford has implemented municipal water restrictions.
Southcentral CO: Dry and windy in most over most of the area. There was some beneficial precipitation between Canon City and Pueblo that allowed native grasses to green up, but that's about it. Irrigation companies are getting nervous about having enough water through the end of the season.
Western CO: Although it's been dry, they feel it hasn't been as bad as eastern CO lately. Has not been as hot this last month with multiple little cold fronts coming through to keep temperatures "cooler". Range conditions are still not in great shape and it's been tough to get livestock processed. It's too late for a good monsoon to do any good at this point in the season since most of the grasses have already stopped growing. The Grand Mesa is significantly dry but the mountains to the east look better.
Southwest CO: Very dry. Have been some storms above Pagosa Springs, but precipitation hasn't made its way down. Dew points have been so low in Pagosa that 27F temperatures a few weeks ago didn't even put frost on the ground. Cortez does not look good, just very dry.
SLV: Very dry. About an inch of precipitation since October 1 in the CoCoRaHS gauge. Folks are moving cows to the mountains this week. The lower elevation range is at about 30% of normal usage. And some mountain pastures around 9000-9500ft may not be grazable this year. Ditches that pull from the Rio Grande that normally shut off much later in the summer and into fall, were shut off two weeks ago. There probably won't be much recharge to the aquifer and groundwater sprinklers will probably be shut off early.
Northeast CO: May was okay on the plains, then June was dry and hot. It looked like it was going to be a good harvest until June. Wheat harvest will be at least 2 weeks earlier than expected. It was looking good and healthy until recently. Grasses greened up, but didn't grow. Luckily the South Platte basin has good reservoir storage so irrigators should be in better shape. There may be some ground water pumping issues though.


| The top two images show Climate Prediction Center's Precipitation and Temperature outlooks for 8 - 14 days. The middle image shows the Weather Prediction Center's Quantitative Precipitation Forecast accumulation for seven days. The bottom left image shows the 3-month precipitation outlook from Climate Prediction Center, and the bottom right image shows the Climate Prediction Center's most recent release of the U.S. Seasonal Drought Outlook. |

 >
>
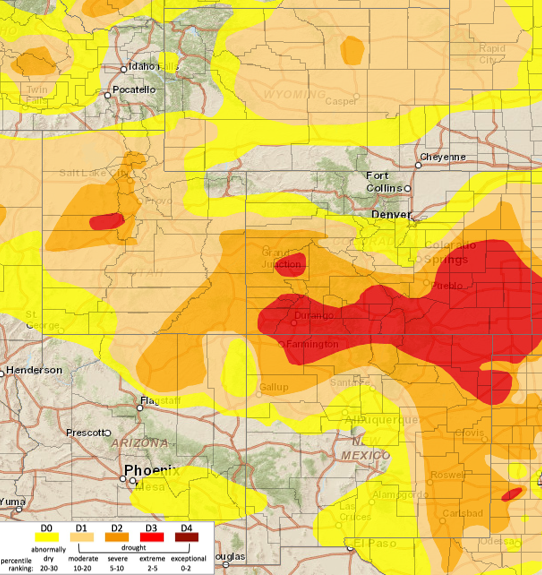
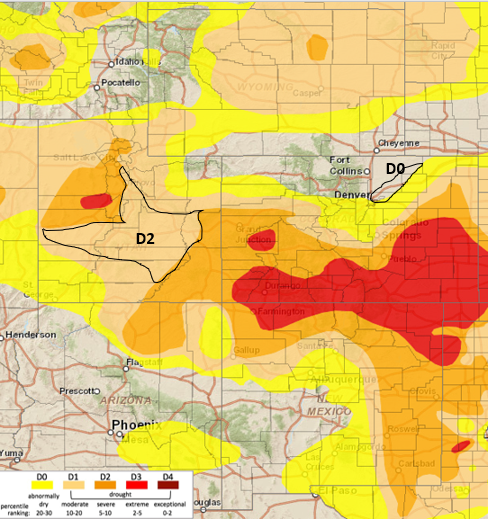
| Above is the most recent release of the U.S. Drought Monitor map for the UCRB region. Below shows the proposed changes for this week, with supporting text. |
|
Summary: June 30, 2020 Last week the Intermountain West region saw dry conditions west of the Continental Divide and spotty precipitation east of the Divide. The Upper Colorado River Basin and Arizona saw little to no precipitation. Northwest Utah and northwest Wyoming did see some nice precipitation amounts. Eastern Colorado, Wyoming and New Mexico saw spotty precipitation with the higher amounts up to 2" and the lower amounts less than 0.25". Temperatures over the region were still above normal, in the 2 to 4 degrees above normal range. This was a slight break compared to the rest of the month for eastern Colorado, which has seen temperatures in the 4-8 degree above normal range. The hot conditions this month in eastern Colorado have had a very large impact on the evaporative demand. Reference evapotranspiration rates have increased significantly in June to the point where what little precipitation has fallen is evaporated back to the atmosphere before it can do any good to plants. There are reports that even the weeds in southeast Colorado did not have much of a green-up. Streamflow in the UCRB has decreased significantly and most streamgages in the basin are reporting below to much below normal flows. The key sites on the Colorado, Green and San Juan rivers are now below normal flows. In eastern Colorado, streamflows are still in the normal range, for the most part, however, after an early melt out, flows are expected to come down sooner than normal. The precipitation outlook for the next 7 days is showing some precipitation through the middle of Colorado extending into northern New Mexico and the San Juan Mountains. The rest of the IMW is looking dry. The 8-14 day outlook does not look good, with elevated chances of above normal temperature and below normal precipitation.
Recommendations: UCRB: Status quo for most of the UCRB, see Utah recommendations for the western portion of the Basin. Conditions seem to match up with the USDM depiction. Eastern Colorado: An increase of D0 into Weld County covering all of Morgan County is recommended. This area has been drying out and missed out on the precipitation that fell last week. This D0 increase will extend from the D0 to the southeast. Utah: It is being recommended the D2 drought areas in Utah be connected through Emery, Sanpete, Sevier, Millard, Wayne, and part of Garfield counties. This area according to data and on the ground reports is just as bad as other D2 areas in Utah. |