|
|
Drought Early Warning System June 30, 2020 |
|
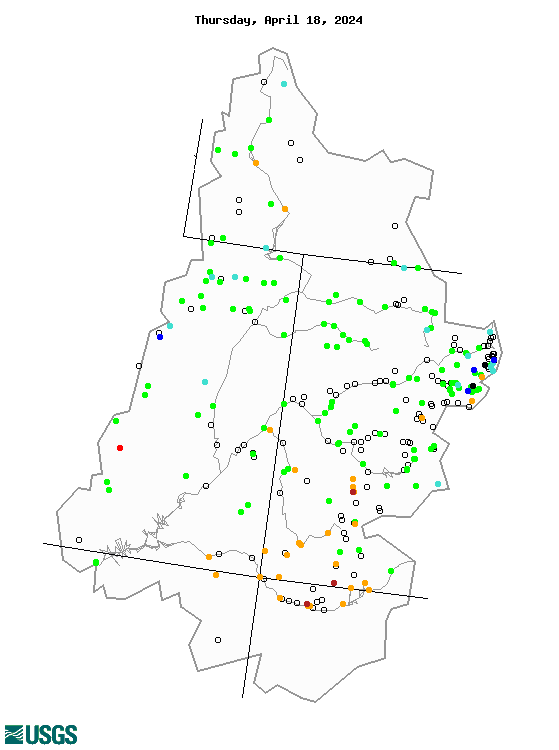
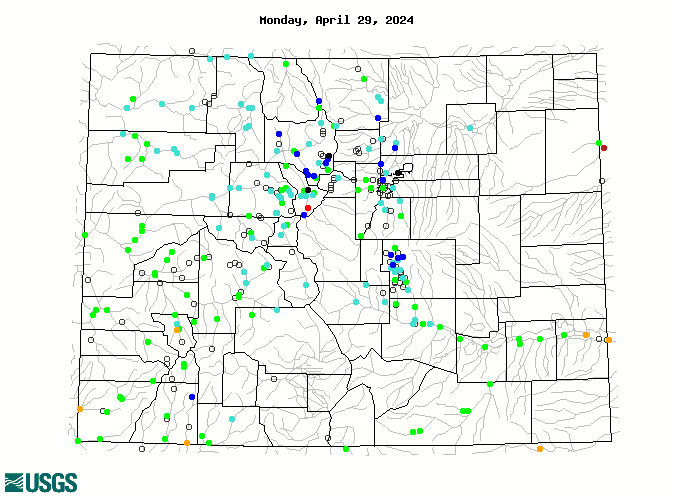
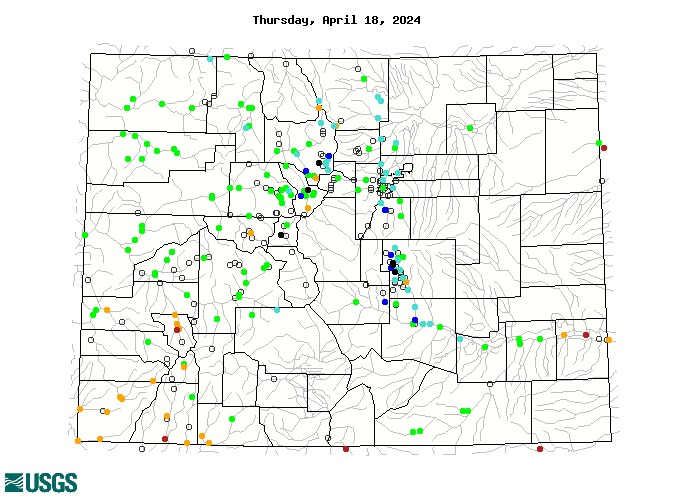
Streamflow Maps ![]()
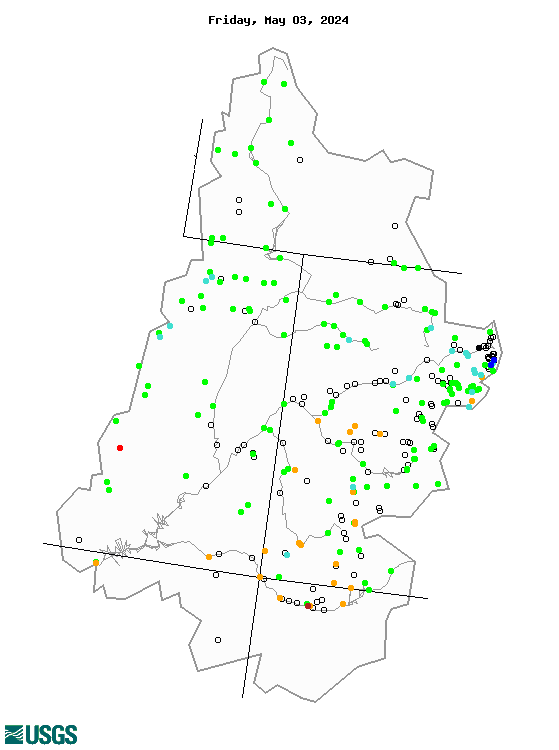
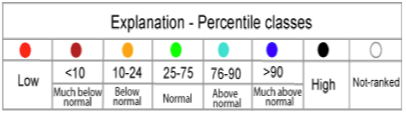
| Low | < 10 | 10-24 | 25-75 | 76-90 | > 90 | High |
|---|---|---|---|---|---|---|
| 0% | 9% | 48% | 44% |
0% |
0% | 0% |
7-Day Average Hydrographs ![]()
Cumulative Flow Plots ![]()
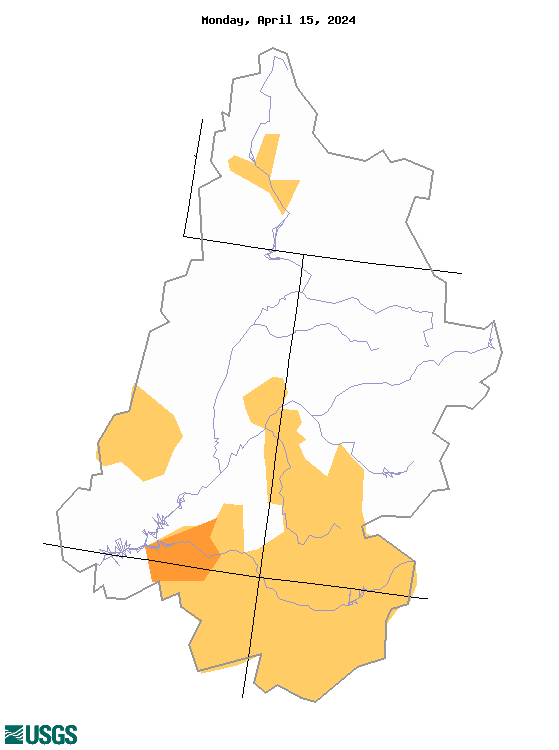
45-Day Streamflow Index ![]()
All the above images are provided by the United States Geological Survey and are updated daily. Hydrographs and cumulative plots are provided for three key sites located around the Upper Colorado River Basin: The Colorado River at the CO-UT state line; the Green River at Green River, UT; and the San Juan River near Bluff, UT. The 45-day average index is assigned to the entire basin based on the conditions for all gages in the basin over the past 45 days. An index number of 4 represents the near normal range of flows (25th - 75th percentile).
Streamflow on Rio Grande at Del Norte ![]()
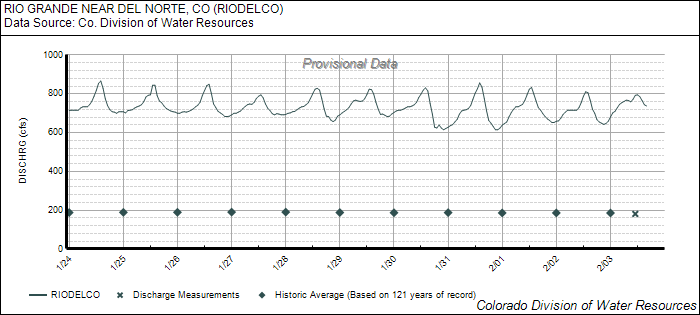
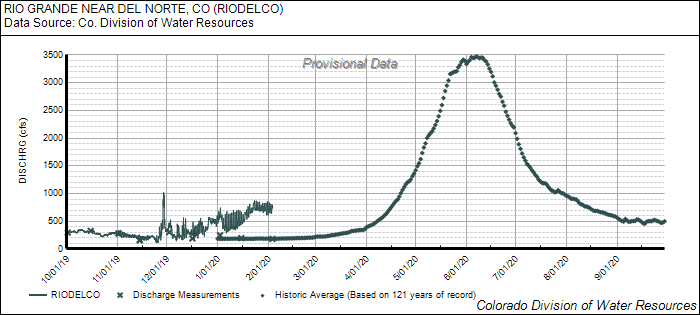
Daily mean discharge for the Rio Grande near Del Norte is provided by the State of Colorado. The products on their page are updated daily, but typically updated on this site every Monday.