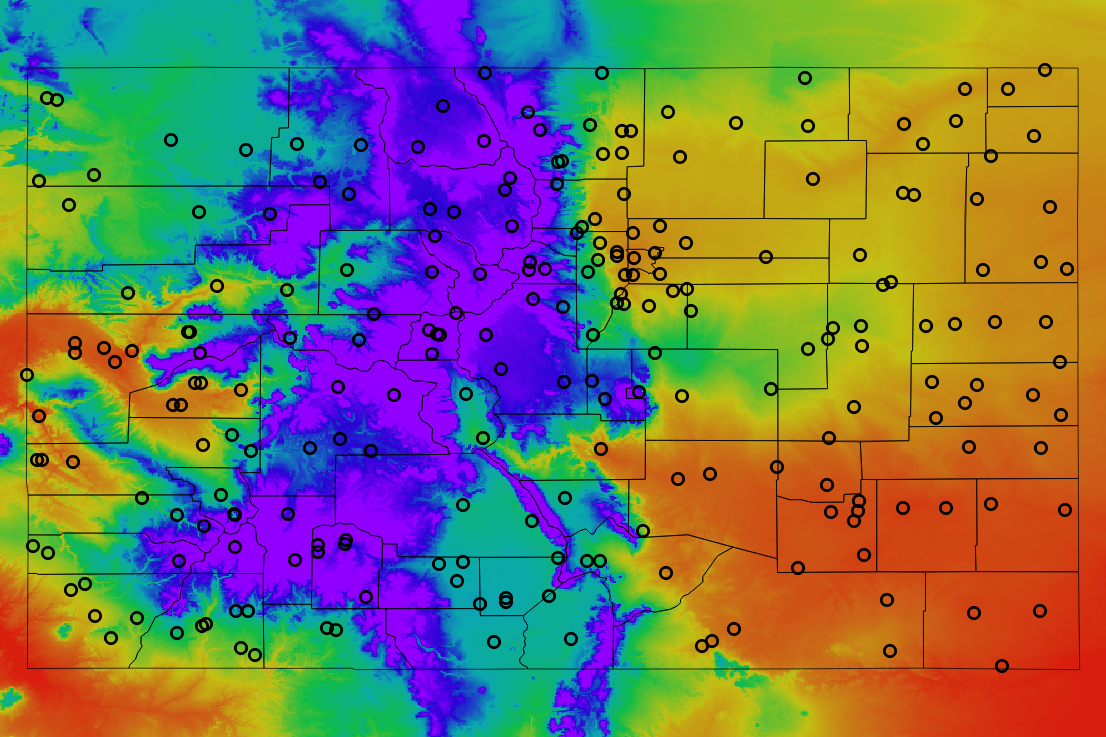

Map displays high resolution gridded PRISM data. Map is contoured using 1981 - 2010
annual average temperature values.
Open circles show locations of long-term NWS COOP stations. Hover over a station to see station name. Click on the station to view a graph of the average monthly maximum and minimum temperatures for the entire year.
Open circles show locations of long-term NWS COOP stations. Hover over a station to see station name. Click on the station to view a graph of the average monthly maximum and minimum temperatures for the entire year.