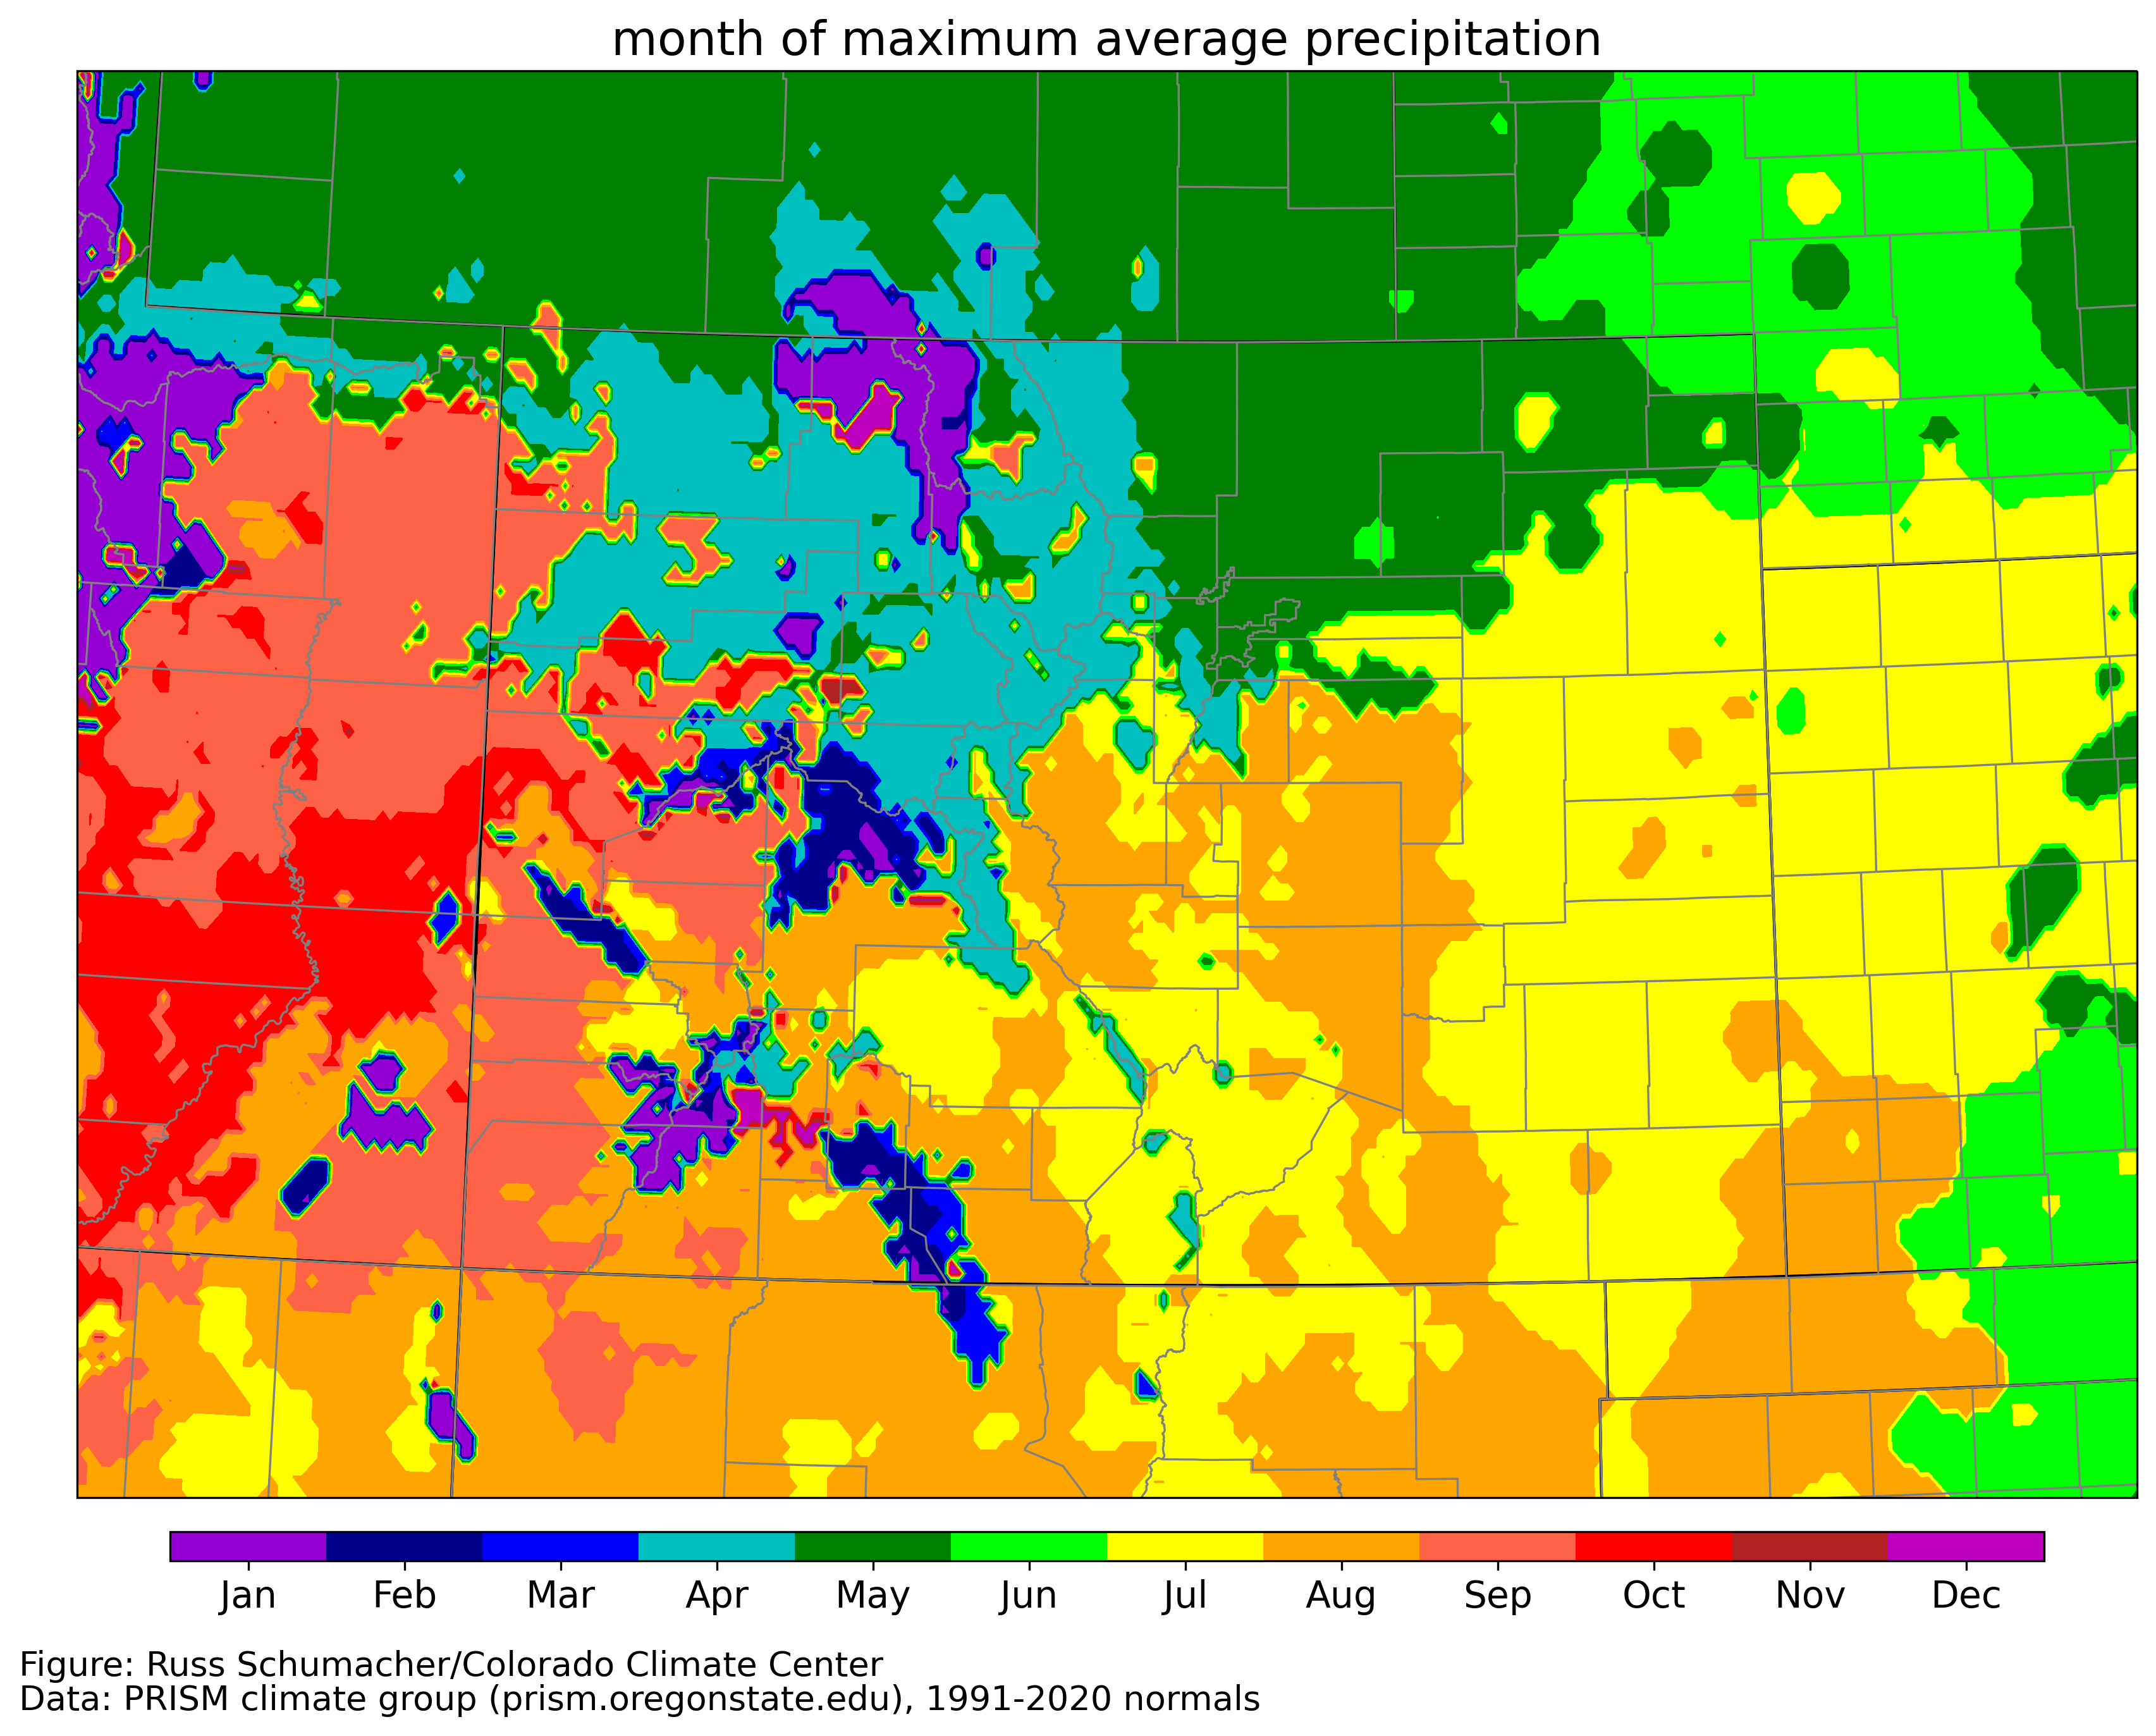
What are these maps showing me?
For each month of the year, you are looking at the proportion of annual precipitation that
typically falls within that month. Essentially, you are seeing how "important" each month
is in contributing to the annual total.
The color scale displays the contribution such that green colors mean a greater proportion
of the precipitation falls within that month and brown colors mean a smaller proportion
of the precipitation falls within that month. In simple terms, green colors indicate the "wet"
season for those locations, and the brown colors show up for the "dry" season.
Why is this important?
Climatologists regularly refer to conditions as being "wetter than average" or "drier than
average." And these maps show that the time of year can play a major role in how significant
those climate anomalies are. For example, in northeast CO, January is a very low accumulating
month. They could have 200% of average precipitation for January, but that could have little
impact on their seasonal or annual accumulations. However, if they got 200% of average
precipitation in June (which is part of their wet season), that would mean a lot of water!
It's good to know how much each month contributes, especially when monitoring drought. Precipitation
deficits during the dry season can easily be made up, so lower % of average in a brown area
might not carry as much weight. But deficits can quickly escalate in the green shaded areas, and
can be harder to make up, especially as you enter the dry season again. Keeping an eye on
current conditions, how that compares to normal, what "normal" means, and how important the
normal is given the time of year, are all important components to consider.
How are these maps created?
These maps are based on PRISM monthly climate normals, which are calculated for the 1981-2010 period
at a 4km gridded resolution. PRISM data is available here, and uses National Weather Service COOP, SNOTEL, and CoCoRaHS data
as inputs.
Each month's precipitation value is normalized by 1/12th of the calculation. So, a value of
1 means that 1/12th of the annual precipitation normally falls within that month. Values
less than (greater than) 1 equate to a lesser (higher) proportion of precipitation in that month.