Select a climate division and timescale to update the scatter plot.
Each dot plots the precipitation on the x-axis and the temperature on the y-axis. Dots are colored based on temperature and size is based on precipitation. The current year is denoted with a star. 1991-2020 averages are denoted by the dashed lines.
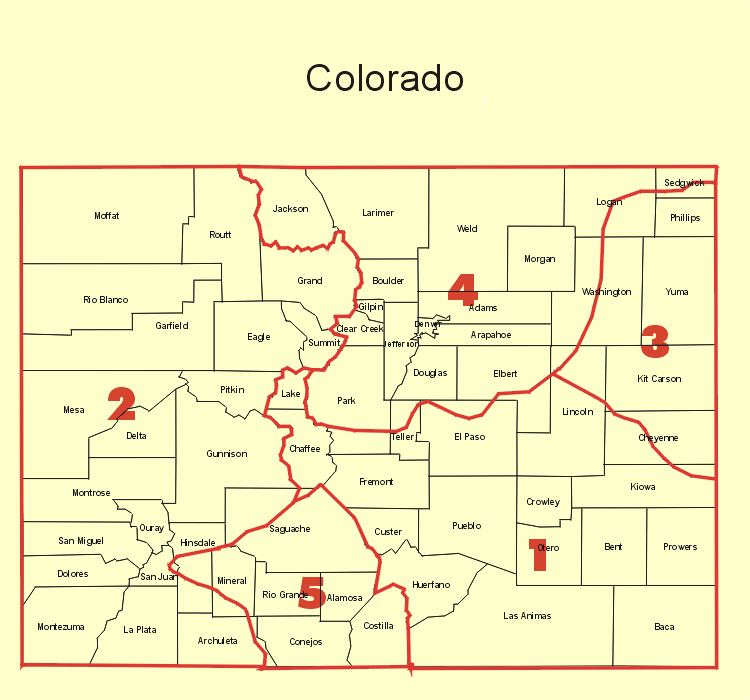
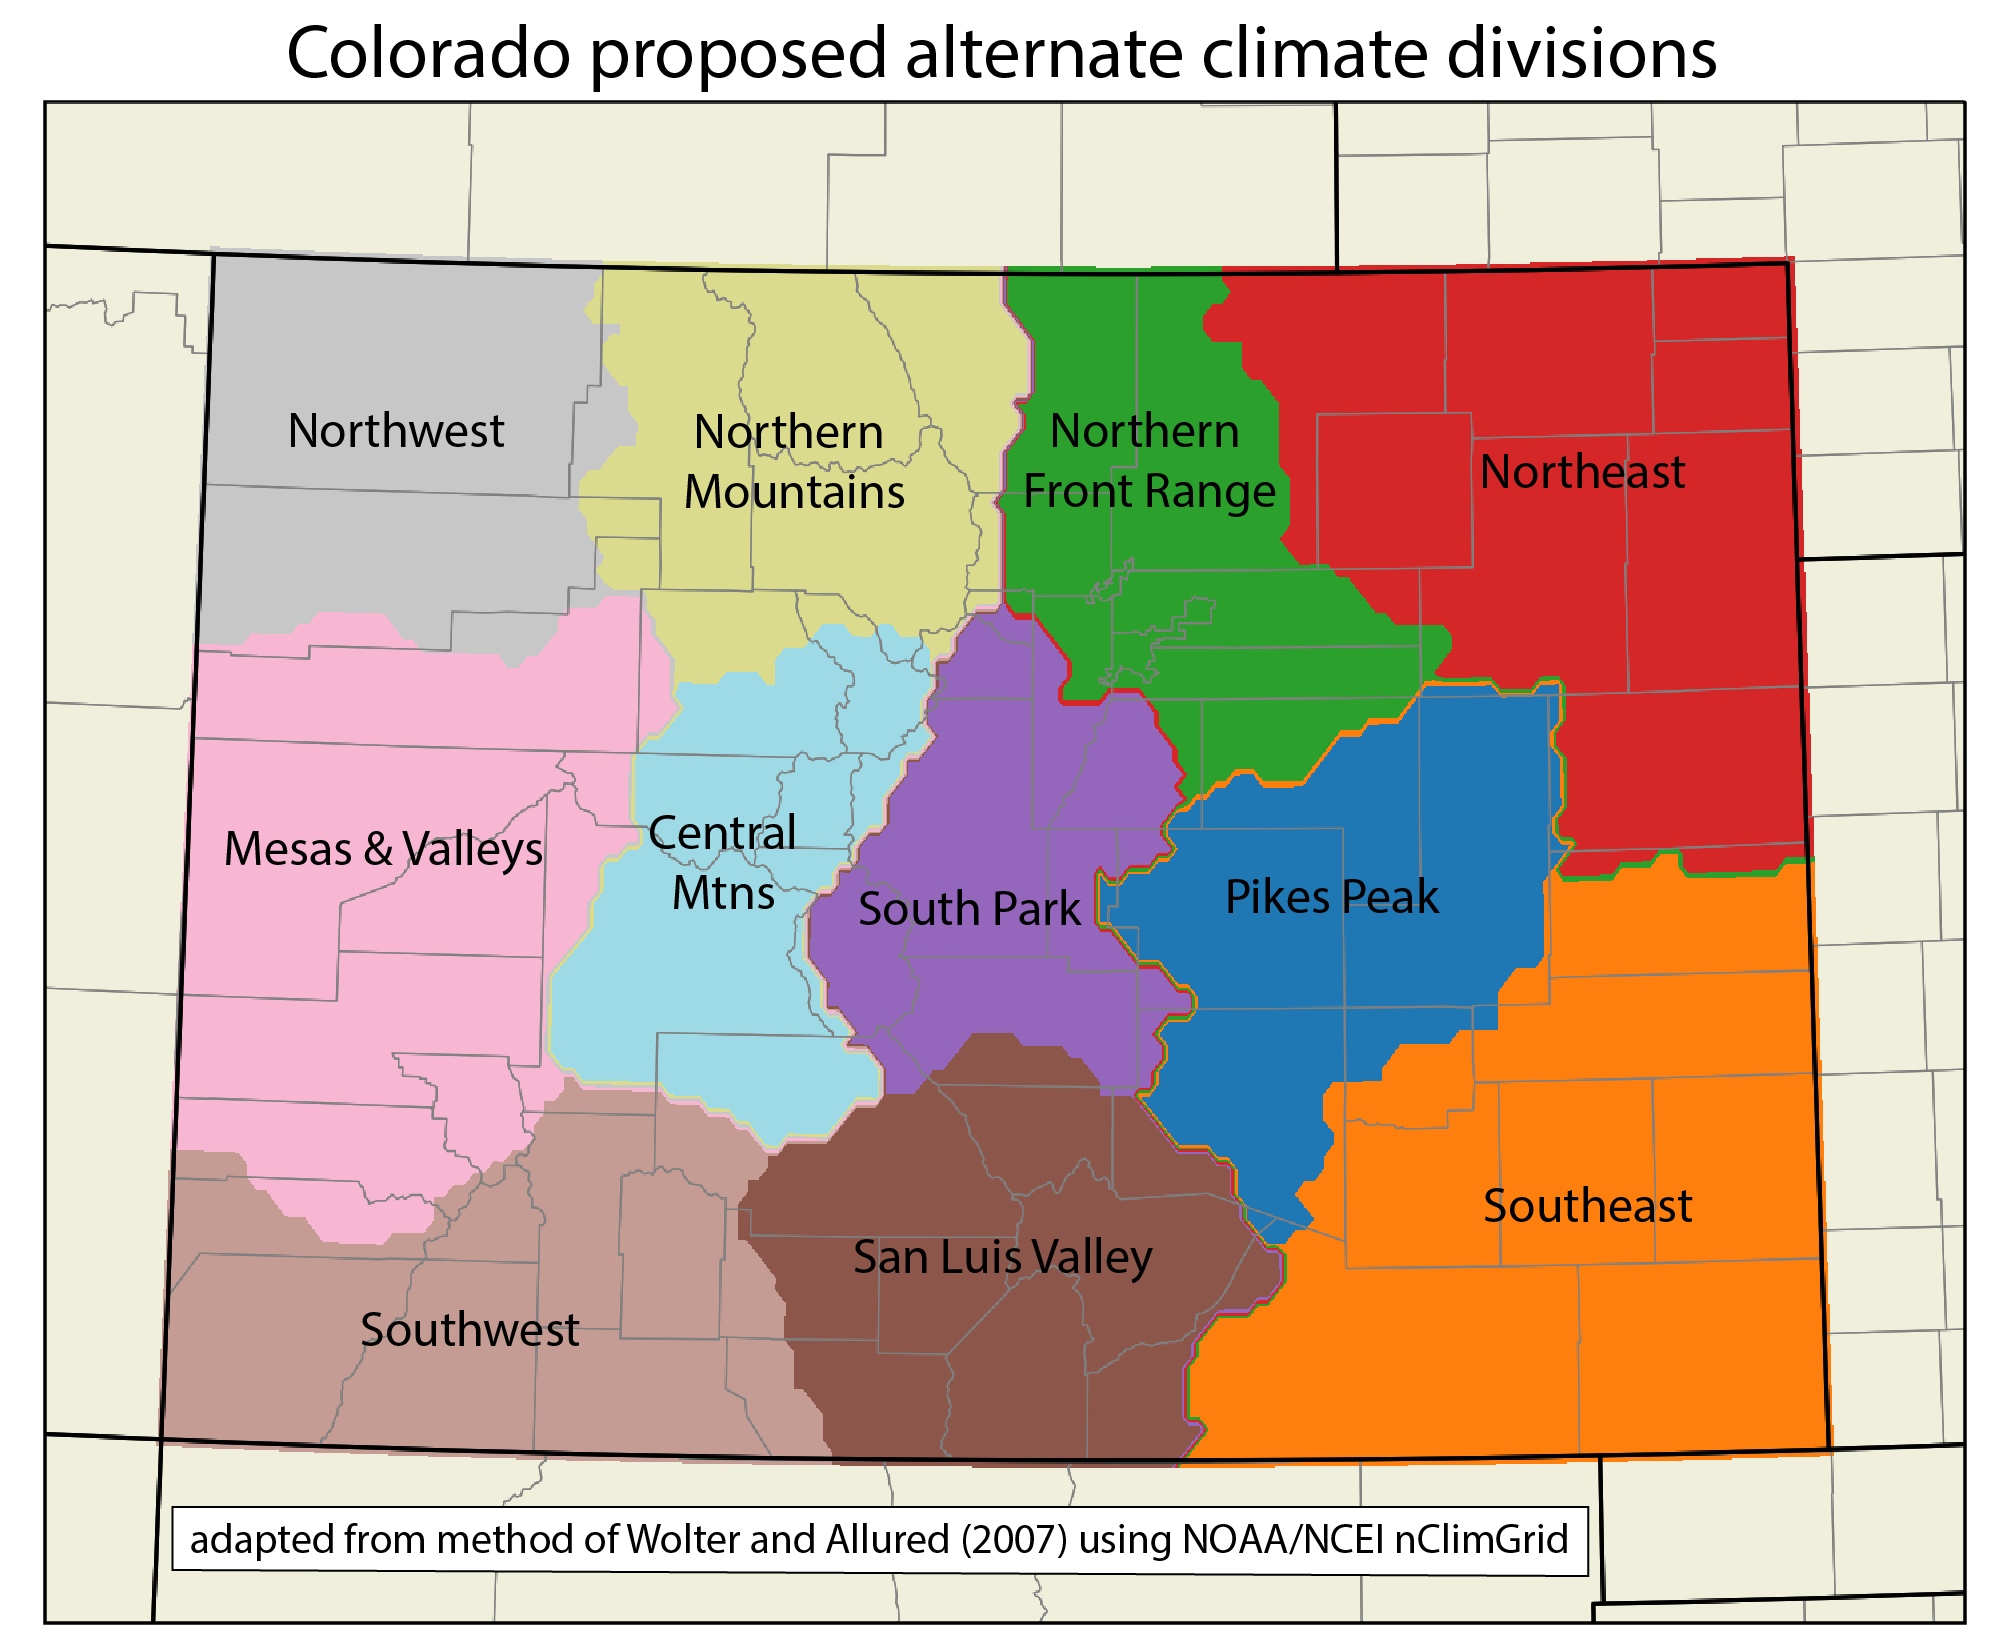
Maps of official NOAA climate divisions and alternate climate divisions: