NOAA's National Centers for Environmental Information provides Climate at a Glance data for the U.S. Here, we provide the monthly data, in a variety of different ways. These data are based on a 5km gridded dataset that incorporates station data and topography to create representative values at the county, climate division, and state scales. Monthly data are available back to 1895, and the most recent month's data is published approximately 7-9 days after the beginning of the next month.
 |
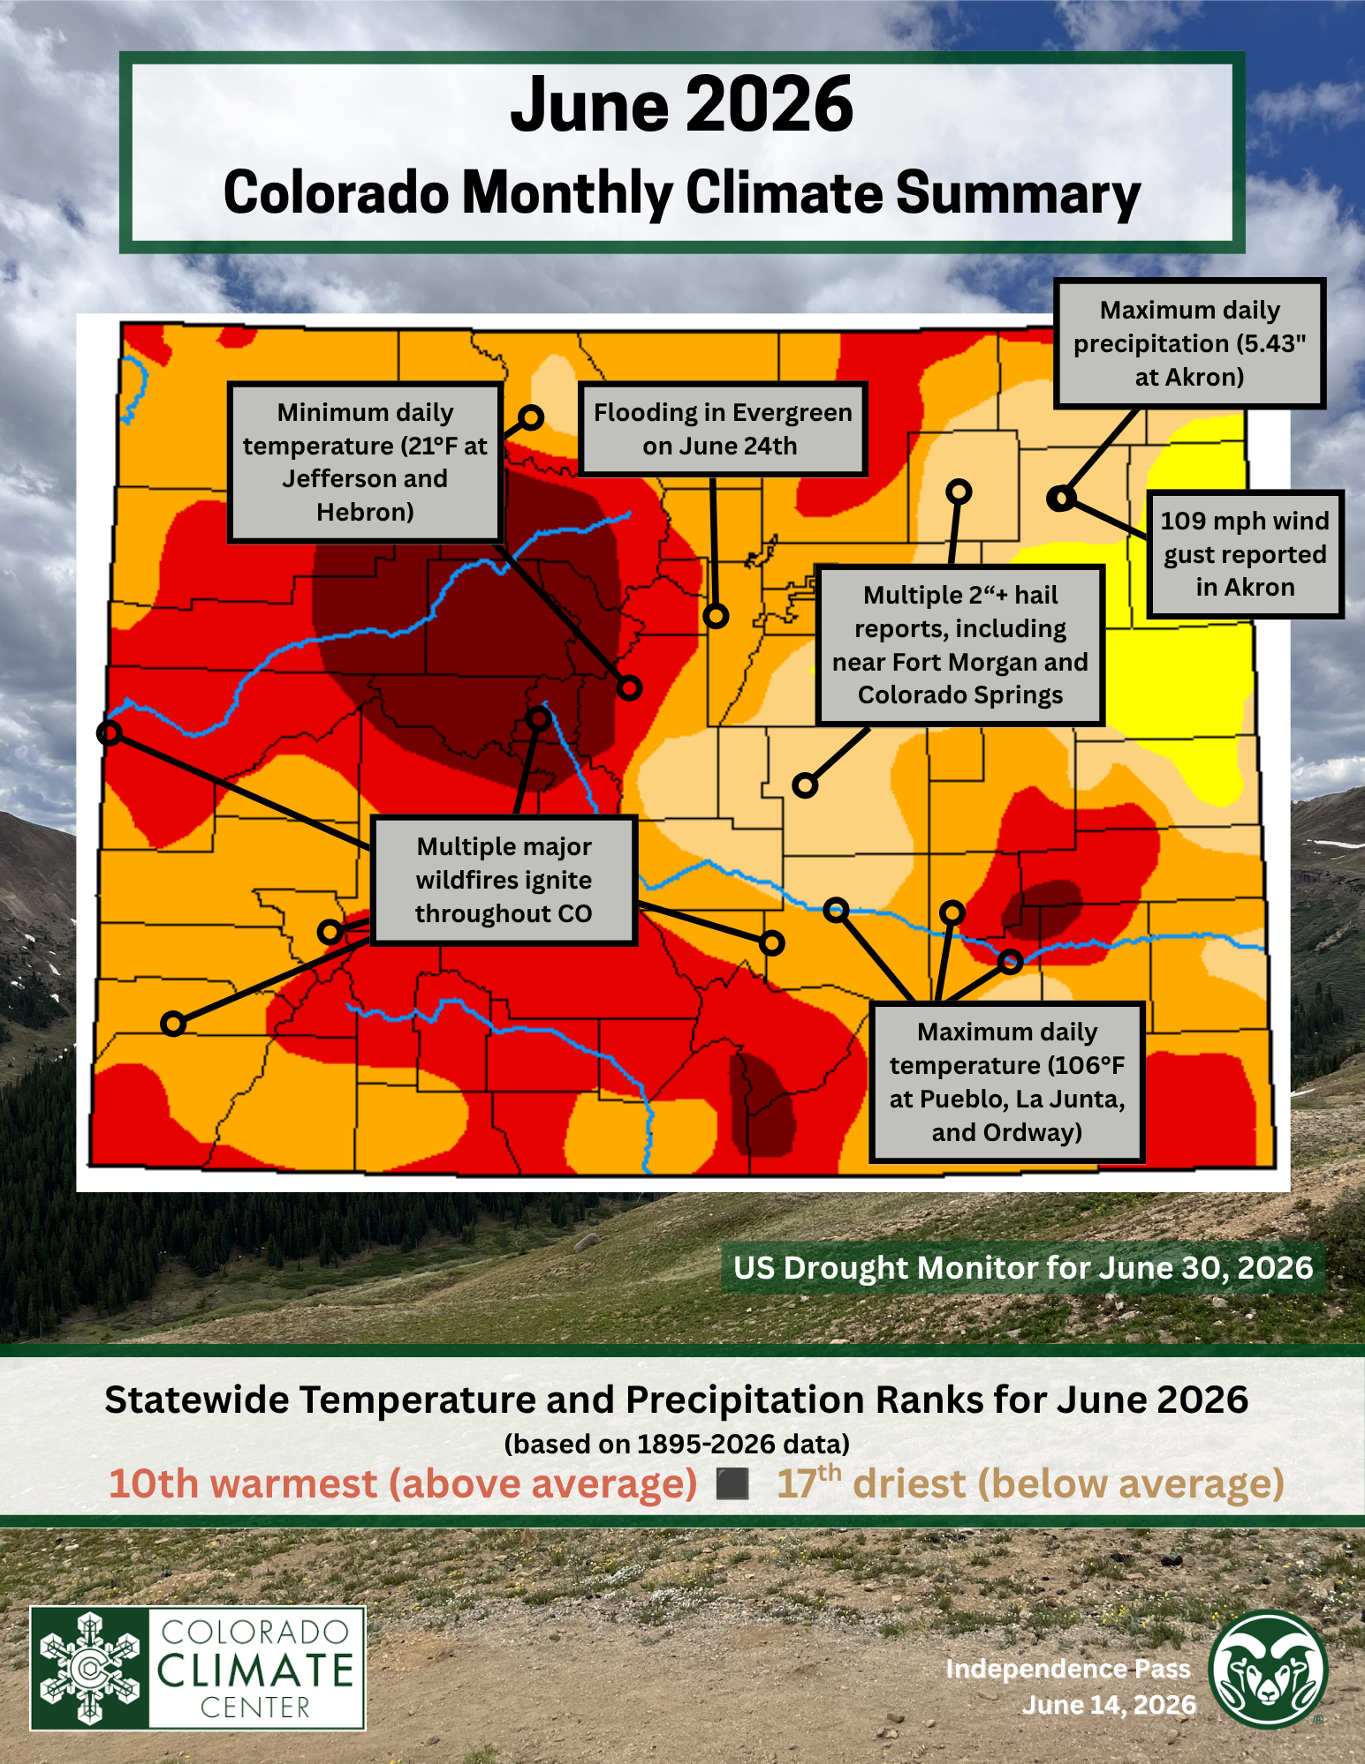 |
Latest Statewide Monthly Climate SummarySummary of Colorado's weather and climate for the most recent complete month. |
Temperature and Precipitation Rank MapsAccess temperature and precipitation rank maps for 1-12 month timescales back to 1895. |
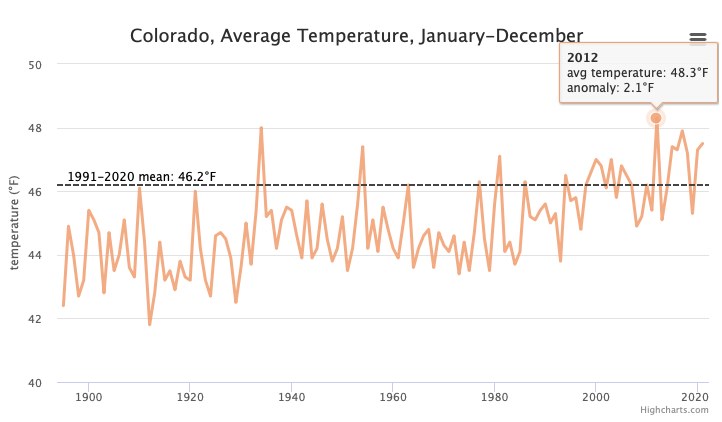 |
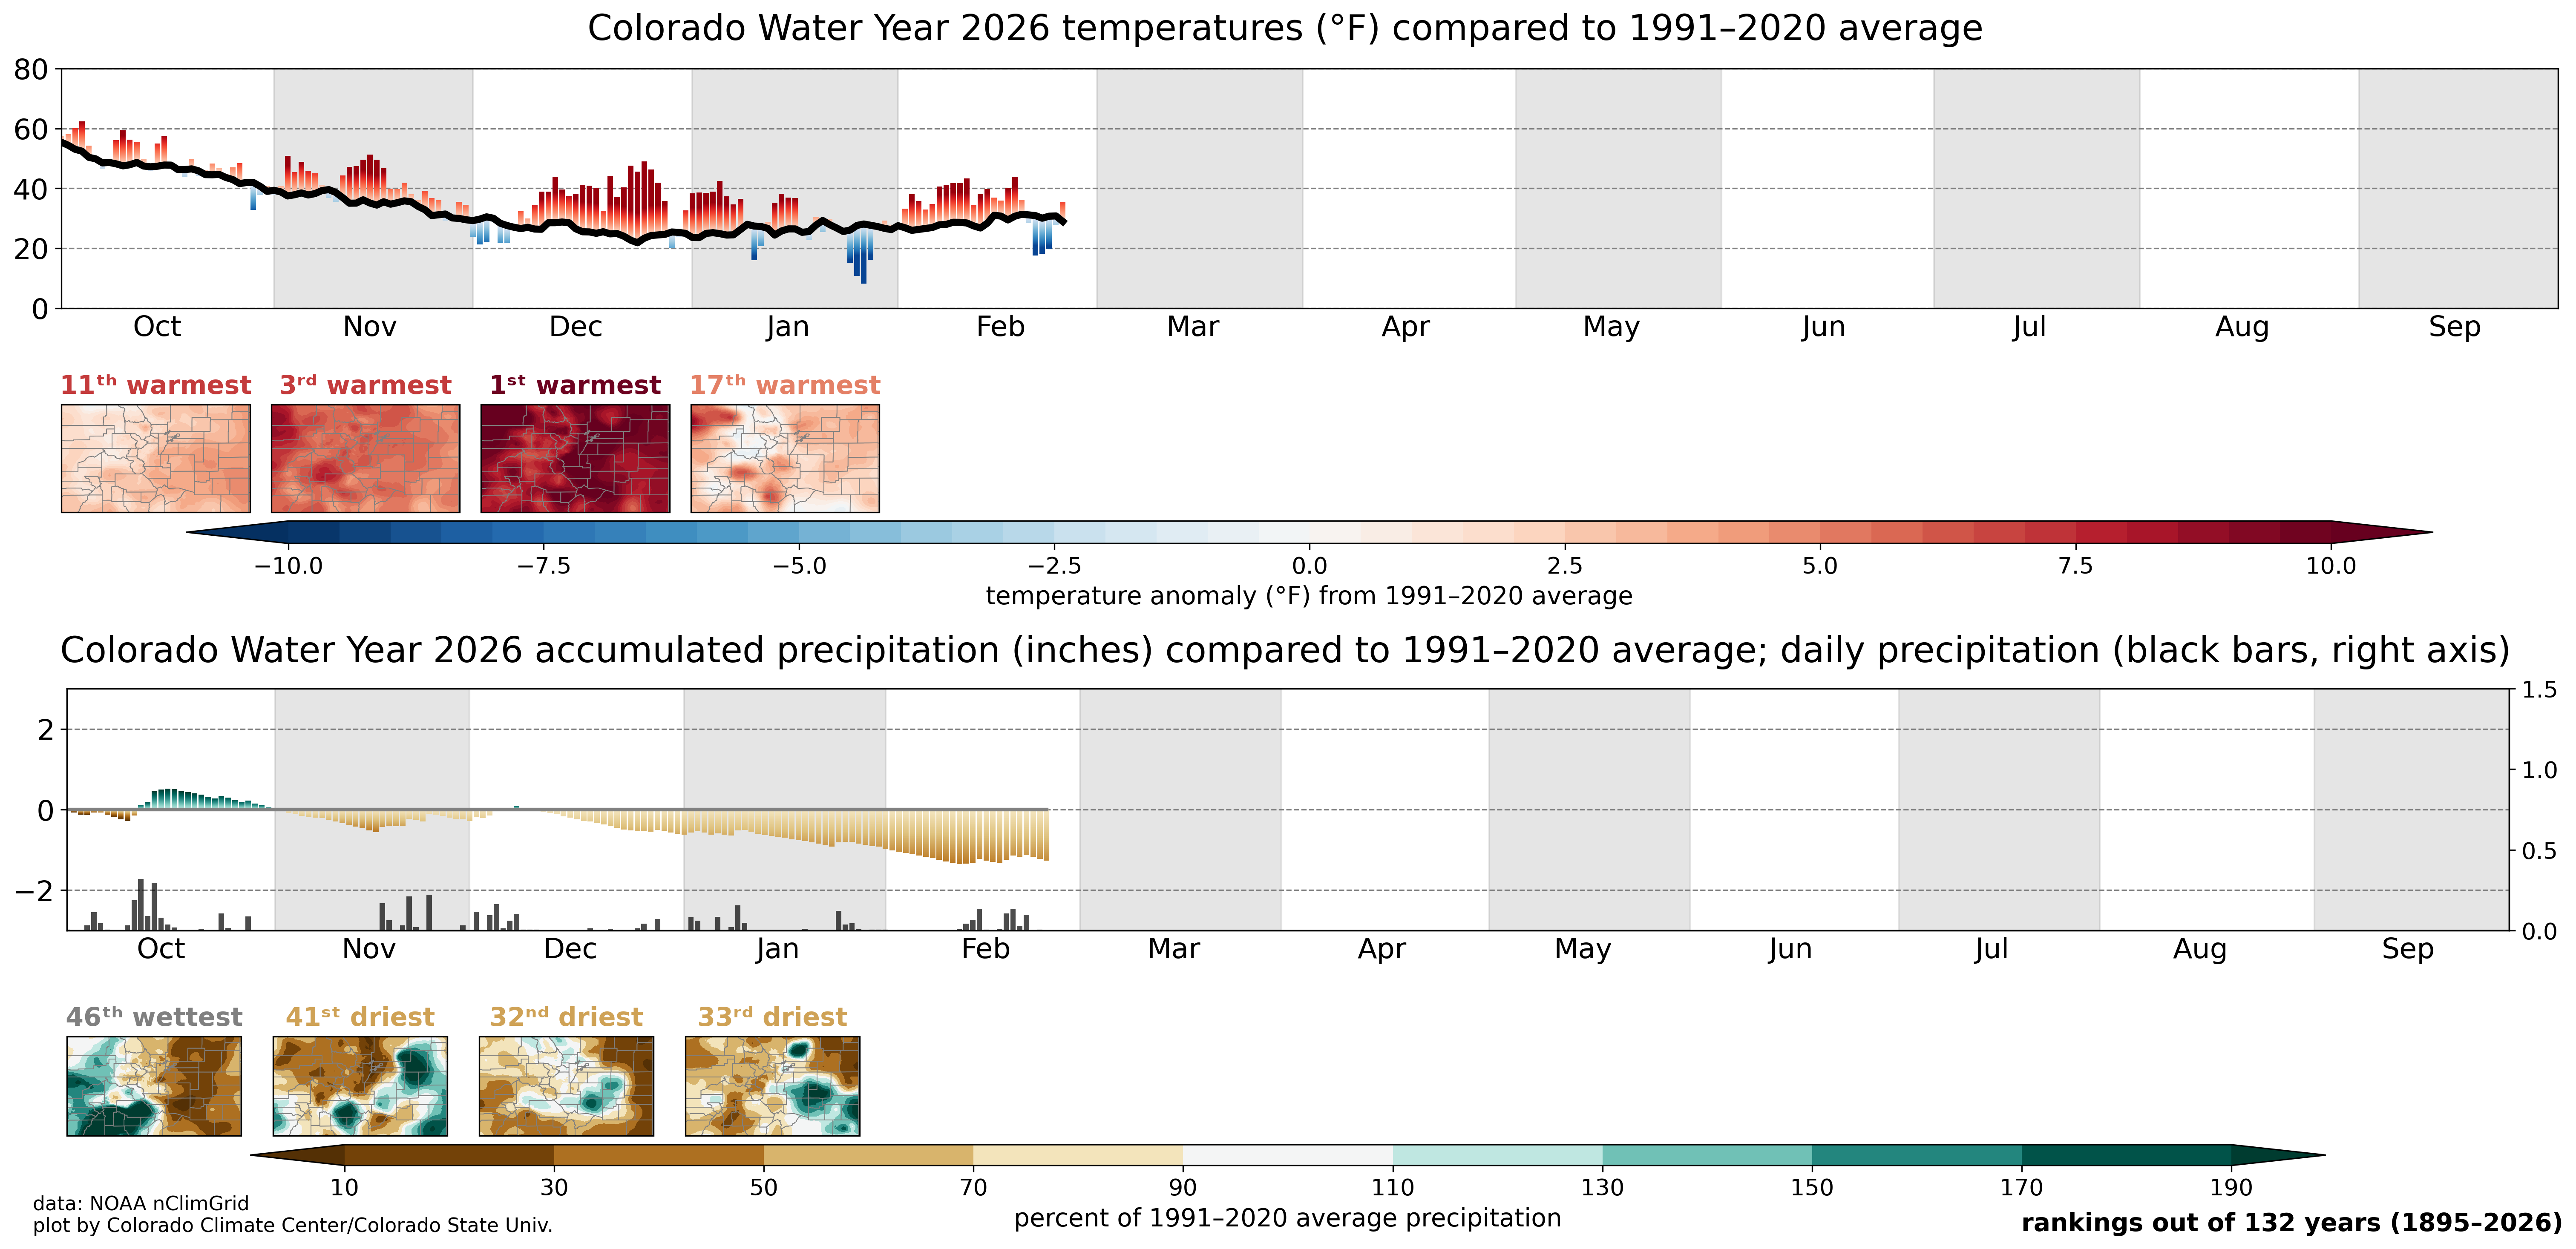
Interactive Time SeriesView monthly temperature and precipitation values for the state and climate divisions. Variables plotted for each month (or selected time scale) include 1991-2020 average. |
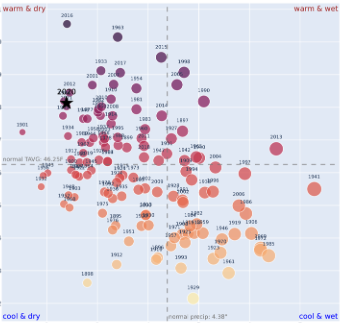 |
Interactive Quadrant ChartsEach dot plots the precipitation on the x-axis and the temperature on the y-axis. Dots are colored based on temperature and size is based on precipitation. The current year is denoted with a star. 1991-2020 averages are denoted by the dashed lines. |
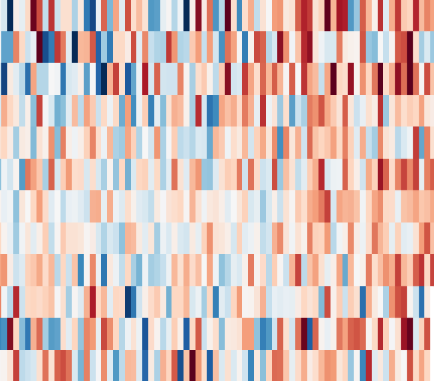 |
Statewide Temperature AnomaliesThese interactive heat maps show monthly and seasonal statewide temperature from 1895-current in three different ways: monthly anomaly compared to 1901-2000 average, top 10 hottest and 10 coldest ranked months (seasons), and as a standardized anomaly.View trends in temperature |
 |
Statewide Precipitation AnomaliesThese interactive heat maps show monthly and seasonal statewide precipitation from 1895-current in three different ways: monthly anomaly compared to 1901-2000 average, top 10 wettest and 10 driest ranked months (seasons), and as a standardized anomaly. |