


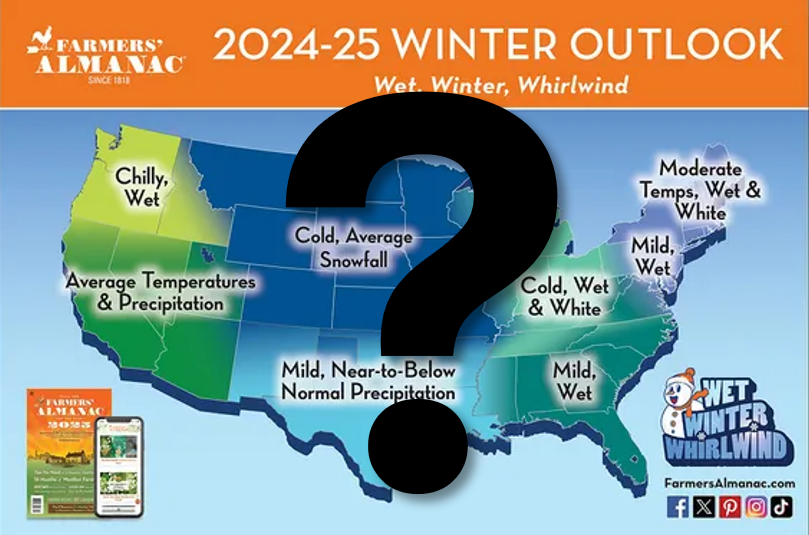
The Farmer’s Almanac released their official winter forecast map for winter 2024-2025, and in the meteorological community this means… nothing. Despite the consistent national and local media attention the Farmer’s Almanac gets year-after-year, and assertions about its fabled accuracy, it is not a tool that the scientific community uses or endorses.
Seasonal forecasting is a very difficult problem, and the forecasts are often wrong, sometimes even verifying worse than a random guess, so why wouldn’t weather forecasters embrace the Farmer’s Almanac? There are two major reasons: 1. The Farmer’s Almanac’s seasonal forecasting methods are not transparent, and 2. The Farmer’s Almanac is not skillful.
Let’s start with the lack of transparency: There is no peer reviewed scientific literature backing the Farmer’s Almanac’s seasonal forecasting methods. In fact, their methods aren’t even disclosed. This from farmersalmanac.com: “Over the years, various methods have been used to make the Farmers’ Almanac predictions, including studying sunspot cycles, solar activity, tidal forces, and even the reversal of winds in the stratosphere over the equator.” They add: “The Moon acts as a “meteorological swizzle stick,” occasionally stirring up atmospheric disturbances with its cyclical and predictable movements…” As a climate scientist, this description of methods does not instill me with confidence. While we know that sunspot cycles, and the quasi-biennial oscillation (reversal of winds in the stratosphere over the equator) do influence seasonal weather to some degree, there is no mention of some of the largest tools used by in seasonal forecasting: the El Niño Southern Oscillation (ENSO), the Madden-Julian Oscillation (MJO), and trends associated with climate change. As for the moon being a “meteorological swizzle stick,” yes, the moon actually does impact the weather. The atmosphere is a fluid just like the ocean, and a full moon stretches the atmosphere out slightly much like the ocean tides. This effect has been shown to raise precipitation rates, but only by 1-2%. Furthermore, this is a daily cycle. Whether the moon is new or full, we face the moon once/day. How can a daily cycle, which is always present, be used to make a forecast more accurate for the whole winter? I would ask the Farmer’s Almanac forecaster my questions personally, but the forecaster (yes, it’s apparently just one person, not a team) who goes by the pseudonym Caleb Weatherbee, remains anonymous so he is not “hassled.” I believe a seasonal forecaster should be able to defend their forecasting methods against the scruples of scientific peer review and public comment.
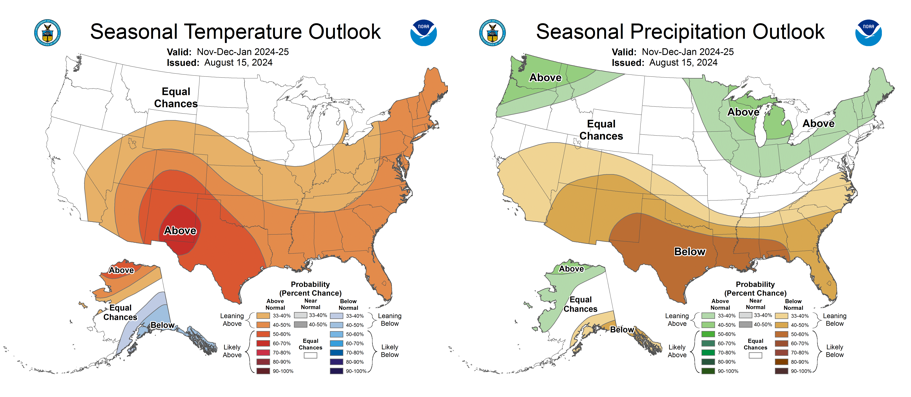
What about accuracy? The average customer probably will not care that the Farmer’s Almanac methods are opaque so long as the forecasts are accurate. A 2010 Weatherwise study from the University of Illinois used a list of 32 cities to test the accuracy of the Farmer’s Almanac and found that it was just under 52% accurate; not much better than a coin flip. Yet the tool’s popularity persists. Why? Have the forecasts improved? Are they equal to, or better than, the seasonal forecasts climatologists and meteorologists look at? For this blog, we evaluate the skill of the Farmer’s Almanac winter outlooks relative to the National Weather Service’s Climate Prediction Center CPC seasonal outlooks over the last five years (winter 2019-2020 through winter 2023-2024). The current CPC winter forecast is shown below:
The data: We used 4km resolution Parameter-elevation Regressions on Independent Slopes (PRISM) modeled climate data from across the contiguous United States. PRISM leverages observations from trusted weather networks (such as the National Weather Service Cooperative Observer Program) and uses physically derived relationships between meteorological variables and elevations/slope angles to create beautiful, spatially complete reanalyses of our weather. We averaged December-February PRISM temperatures and precipitation over the regions shown in the Farmer’s Almanac above. This is our forecast verification dataset. A description of which states are in which region is available in the following table (bear in mind that the Farmer’s Almanac drew these regions, not me. I would never consider Tennessee part of the “Great Lakes” region):
| Region Name | States Included | 1991-2020 33rd Percentile December-February Temperature (Fahrenheit) | 1991-2020 33rd Percentile December-February Precipitation (inches) | 1991-2020 67th Percentile December-February Temperature (Fahrenheit) | 1991-2020 67th Percentile December-February Precipitation (inches) |
| Pacific Northwest | ID, OR, WA | 29.64 | 11.15 | 31 | 14.16 |
| Southwest | AZ, CA, NM, NV, UT | 37.63 | 5.1 | 38.95 | 7.7 |
| North-Central | CO, IA, KS, MN, MO, MT, ND, NE, SD, WY | 20.97 | 2.9 | 24.96 | 3.22 |
| Great Lakes | IL, IN, KY, MI, OH, TN, WI, WV | 27.51 | 7.44 | 30.34 | 9.3 |
| South-Central | AR, LA, MS, NM, OK, TX | 43.64 | 6.33 | 45.3 | 7.88 |
| Southeast | AL, FL, GA, NC, SC, VA | 46.89 | 10.57 | 48.82 | 12.68 |
| Northeast | CT, DE, MA, ME, NJ, NH, NY, PA, RI, VT | 23.64 | 9.39 | 26.92 | 10.59 |
Selecting Forecasts for Evaluation: One of the problems with testing the skill of the Farmer’s Almanac forecasts is that most of the language is subjective. For example, the Farmer’s Almanac forecast for winter 2022-2023 in the North-Central region was “Hibernation Zone. Glacial, Snow-Filled.” How does one evaluate this forecast? Is a normal, or even above normal, winter in the north-central United States not glacial and snow-filled? Because of this we will only evaluate skill in regions where the Farmer’s Almanac declares that temperature or precipitation will be below, near, or above normal. For the sake of consistency, we will only evaluate the Climate Prediction Center in the same number of regions for the same variables. For instance, if the Farmer’s Almanac makes testable claims in two regions for temperature, and one for precipitation, we will use the CPC maps to do the same, testing their two most confident regional temperature predictions, and single most confident precipitation predictions.
Testing skill: It is common for seasonal forecasts to be made using terciles. A tercile represents one third of the probability distribution of a dataset. The lower tercile represents below normal conditions, the middle tercile represents near normal conditions, and the upper tercile represents above normal conditions. For example, if winter temperatures were colder than in 80% of years in the historical record, that would be in the lower tercile (since in over two thirds of years temperatures were greater). In this study we use the following scoring matrix to judge a winter forecast:
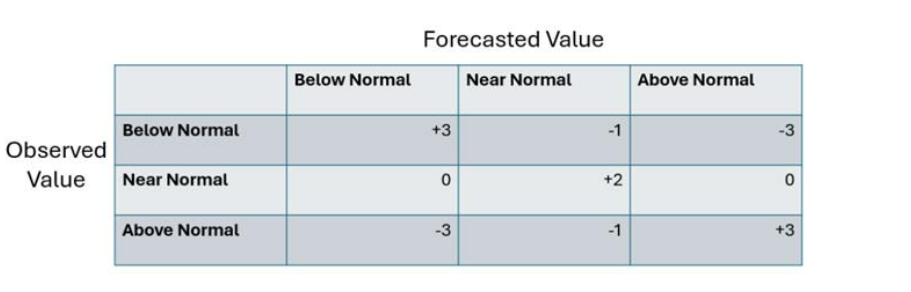
Below normal will be defined as temperatures or precipitation within (or below) the lower third of the 1991-2020 climate normals. Above normal is defined as temperatures or precipitation within (or above) the upper third of the 1991-2020 climate normals distribution for a region. Near normal is defined as the middle tercile in the 1991-2020 PRISM climate normals. For example, if the Farmer’s Almanac forecasts “normal temperatures” for the Pacific Northwest Region in winter 2022, and the PRISM averaged December-February temperatures fall within the 1991-2020 middle tercile range, that forecast is worth +2 points. If it is outside of the middle tercile range, it is worth –1. Upper and lower tercile forecasts work differently: they are worth more points if correct (because the forecaster must be confident in a deviation from normal) but will burn the forecaster if they miss by a wide margin. An upper or lower tercile forecast that is correct is worth +3, but if the opposite tercile verifies, it is –3. Note that the expected value for a lower, middle, or upper tercile forecast is zero if forecasting randomly.
Complications: There are a few problems with these methods that would need to be examined more closely to submit this kind of comparison to peer review: 1. Unlike CPC, the Farmer’s Almanac forecasts, even when calling for below, near, or above normal, make no mention of terciles. The Farmer’s Almanac forecaster may tailor their seasonal forecasts a bit differently if apprised to the rules of our game. 2. It is also worth noting that the CPC forecasts are not deterministic, they are probabilistic. Each grid point is assigned a probability of below normal, near normal, and above normal temperature and precipitation. In this evaluation CPC forecasts are treated as deterministic. In some cases, a CPC forecast is treated as calling for “above normal” or “below normal” temperature or precipitation when CPC is only 40-50% confident in above (or below) the upper (or lower) tercile. 3. The CPC does not use the climate divisions drawn in the Farmer’s Almanac, or any divisions for that matter; it is a gridded product. Determining the regions in which CPC is most confident in the winter forecast sometimes takes some creative eyeballing. Like the Farmer’s Almanac, the CPC forecast team would probably tailor their winter forecasts differently if apprised to the rules of the game. With all the methodology and caveats finally out of the way, let’s play!
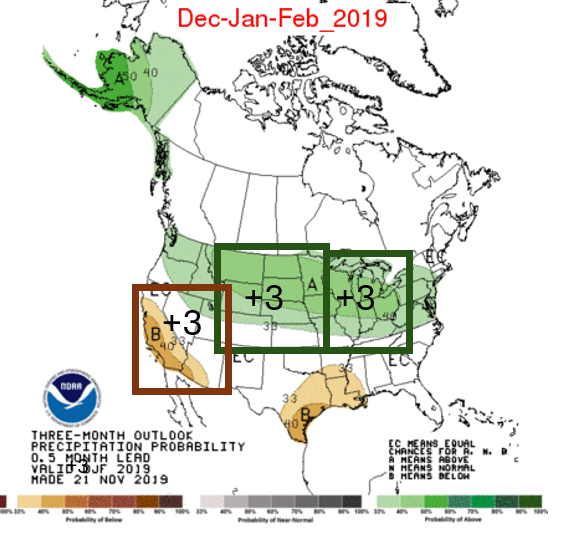
2019-2020: Year number one of our Farmer’s Almanac vs Climate Prediction Center skill challenge is winter (December-February) 2019-2020. If we look at the Farmer’s Almanac forecast, we see a few subjective yet colorful descriptions of winter: “frozen, snowy,” “brisk & wet,” “frosty, wet & white.” These descriptions generally describe the winter climates of the Great Lakes, Southeast, and Atlantic Regions of the United States respectively. However, we do see three claims that we can test using PRISM temperature and precipitation data: “Normal Precipitation” in the Pacific Northwest, “Normal Precipitation” in the Southwest, and “Average Precipitation” in the South-Central Region. We will not distinguish between “normal” and “average” here. For each of these regions, a December-February precipitation value in the middle tercile range of the 1991-2020 normals will be scored as +2, and an outer-tercile value will be scored as –1.
The 2019-2020 Pacific Northwest Region-average December-February precipitation value of 14.26” is ever-so-close to the inner tercile range (11.15-14.16”), but no cigar. -1. The southwest region verified much drier than normal. -1 again. However, the South-Central region value of 7.87” barely squeezes into the inner tercile range of 6.33-7.88”. +2. It’s a wash for an annual score of zero.
The CPC starts strong in winter 2019-2020 with a clean sweep. PRISM-averaged, North-Central Region Precipitation verifies across the region at 3.47”, which, believe it or not, is above the 67th percentile value of 3.22”. This region is so cold in winter that high precipitation events are rare. The Great Lakes Region value comes in at 11.17”, comfortably eclipsing the 67th percentile of 9.30”. The Southwest Region, as stated earlier, was dry, which also matched the CPC forecast.
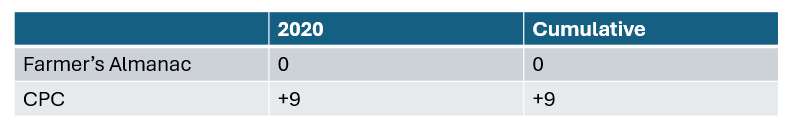
At the end of one round, the scoreboard reads CPC: 9, Farmer’s Almanac: 0 with the CPC achieving the maximum possible score for the round. Is hope lost for the Farmer’s Almanac already? With four of five years remaining, I doubt it!
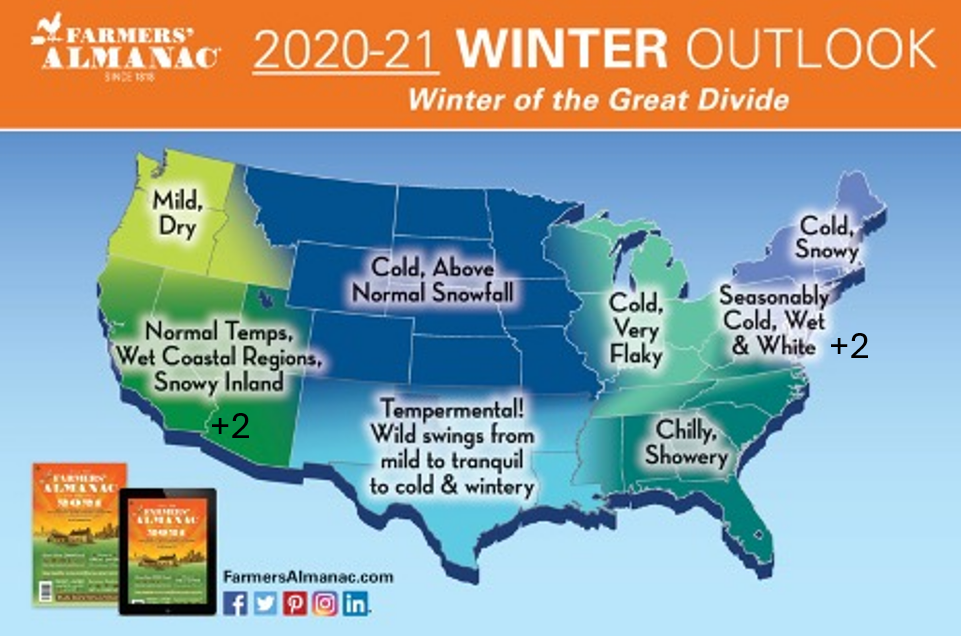
2020-2021: It is a new year and new battle for the Farmer’s Almanac, who have again submitted a forecast with top-notch descriptive language. This forecast includes details about the interregional and intertemporal variation of temperature and precipitation: “Wet Coastal Regions, Snowy Inland” for the Southwest, and “Temperamental! Wild swings from mild to tranquil to cold & wintery” for the South-Central Region. Within this forecast lies two testable claims: “Normal Temps” for the Southwest and “Seasonably Cold” for the… Mid-Atlantic? This region is not used in all years. We will create an ad-hoc region from Virginia up though Pennsylvania that runs from West Virginia to the Atlantic Coast to score this. Indeed, both the Southwest and Mid-Atlantic Regions had near normal winter temperatures, giving the Farmer’s Almanac a score of +4 for the year.
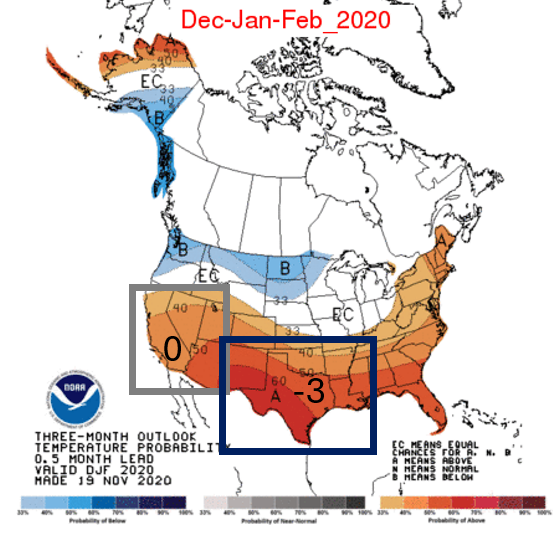
How about the CPC? Given our stated methods, this time, we must test their two most confident regional temperature forecasts. This includes an increased chance of above normal temperatures for the Southwest and South-Central Regions. The Southwest saw near-normal winter temperatures. The Farmer’s Almanac called it. The CPC did not. Does it get better for the CPC from here? Oh no! The CPC’s call for increased chances of a warmer than normal winter in the South-Central Region will not amuse Texans, who had disastrous, and sometimes deadly, impacts from a horrible cold snap in February 2021, which saw millions of Americans without power. This earns the CPC an emphatic –3.
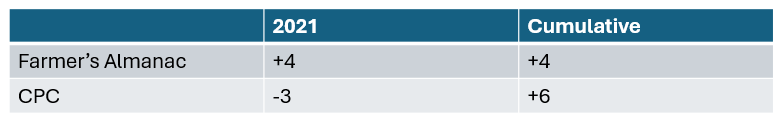
At the end of two rounds the Farmer’s Almanac has nearly drawn even, trailing by a manageable deficit of 6-4.
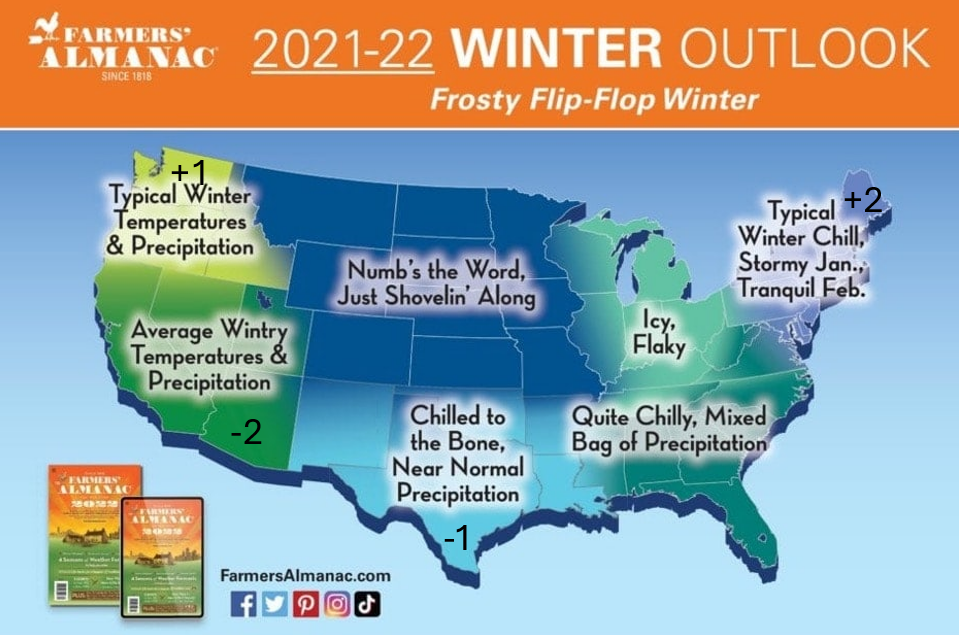
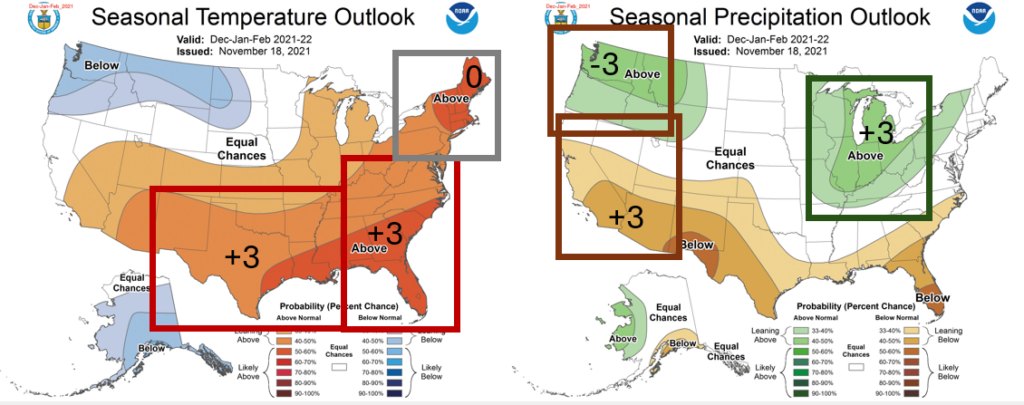
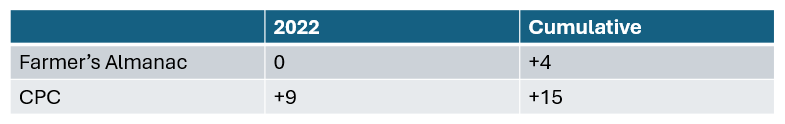
2021-2022: The 2021-2022 winter comes with greater potential for the tide to shift in either direction. The Farmer’s Almanac has submitted a seasonal forecast with six testable claims: three for temperature, and three for precipitation. Descriptive language still abounds, calling for “numb’s the word, just shoveling along” in the North-Central Region. We also have calls for normal, or typical, temperature and precipitation in the Pacific Northwest and Southwest Regions, near normal precipitation in the South-Central Region, and “typical winter chill” in the Northeast Region. The Northeast Region did see “typical winter chill,” with an average temperature of 25.3 °F, comfortably inside the middle tercile. I did want to subtract points for the addition of “stormy Jan, tranquil Feb.” as this was not even close to true. February was easily the coldest month of the winter in New England in 2022. I’ll award credit for the forecast of average winter temperatures, even if the temporal variability was plainly wrong. +2. The Farmer’s Almanac correctly called near-normal winter temperatures in the Pacific Northwest, but precipitation verified just outside of the inner tercile: 11.10” (the 33rd percentile is 11.15”). The Almanac forecast was ugly down south. It called for near normal temperatures and precipitation for the Southwest, and near normal precipitation for the South-Central Region. Both regions were significantly warmer and drier than normal. All tallied, it’s a wash. The Farmer’s Almanac made six testable claims and scored a net zero points.
We evaluated the CPC’s three most confident regional forecasts for temperature and precipitation. The region-averaged December-February temperatures were 45.7 °F for the South-Central Region and 49.7 °F for the Southeast Region. These marks were comfortably in the upper tercile of the 1991-2020 distribution and net the CPC +6 points. The call for an increased probability of above normal temperatures in New England did not pan out, again thanks to that bone-chilling February. Zero points. The CPC also made a smart call in the Great Lakes, forecasting an increased probability of above normal precipitation, likely driven by La Niña conditions. The region average of 9.82” did exceed the 67th percentile of 9.30”. It was a wash out west. The CPC faced a tough break as the increased probability of above normal precipitation in the Pacific Northwest was followed by lower tercile precipitation, -3 points. However, the forecast of an increased probability of below normal precipitation in the southwest did pan out. The December-January value of 4.31” was below normal, netting +3.
Three years of data and 11 total testable claims was enough for the CPC to begin to pull away from the Farmer’s Almanac with cumulative scores of +15 for the CPC, and +4 for the Farmer’s Almanac.
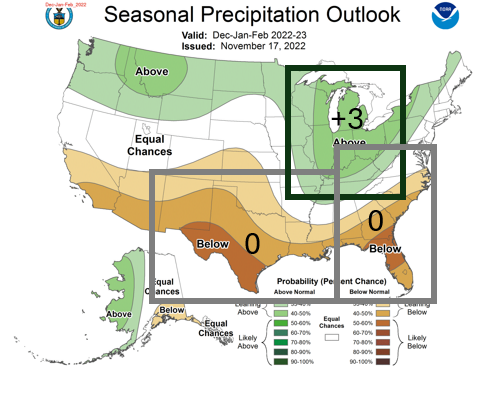
2022-2023: The winter 2022-2023 season brought the third year in a row of La Niña conditions. The prevailing evidence suggests that this is associated with wetter than normal conditions over the northern United States, especially the Great Lakes Region, and drier than normal conditions over the south and southwestern United States. Much warmer than normal Atlantic Ocean temperatures also lent confidence, at least for the CPC, that a warmer than normal winter could occur up and down the eastern seaboard.
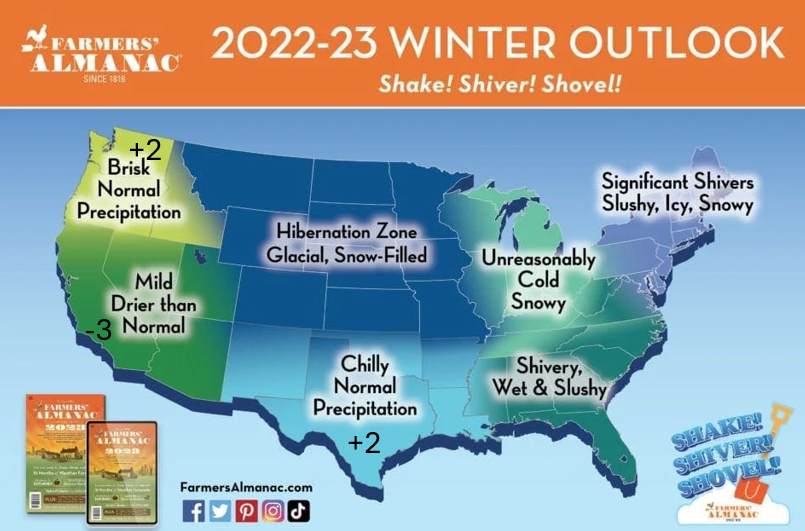
The Farmer’s Almanac forecast featured three testable claims this winter including “normal precipitation” for the Pacific Northwest, “drier than normal” for the Southwest, and “normal precipitation” for the South-Central Region. Other regional forecasts, such as “Hibernation Zone, Glacial, Snow-Filled” for the North-Central Region, and “Significant Shivers, Slushy, Icy, Snowy” for the Northeast Region unfortunately could not be scored.
The Farmer’s Almanac net +1 points in 2023, dropping back down to a cumulative score of just +2. “Normal precipitation” was the correct forecast for the Pacific Northwest and South-Central Regions. The call for “drier than normal” in the Southwest was terrible as much of the Sierra Nevadas and western Rocky Mountains received near-to-record high snowpack in winter 2023. One might also argue that “unreasonably cold” was not a good forecast for the Great Lakes Region, which had one of the mildest winters on record. However, perhaps it is fair to counter that winter in the Great Lakes Region is always “unreasonably cold.”
The Climate Prediction Center net another +3 points in winter 2022-2023 with their three most confident regional precipitation predictions. The Great Lakes Region again verified with above normal precipitation at 9.55″ averaged across the region. The CPC forecast called for an increased probability of below normal precipitaiton in the South-Central and Southeastern Regions. Both of these regions ended up with near normal precipitation, and scored 0 points.
Neither the Farmer’s Almanac nor the CPC had a particularly strong showing in 2022-2023, netting only +1 and +3. After four years, the cumulative scores are +18 for the CPC and +5 for the Farmer’s Almanac. With just one year left in our forecast competition, it would take a crystal ball for the Farmer’s Almanac to make up that kind of a deficit.
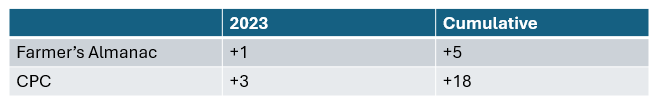
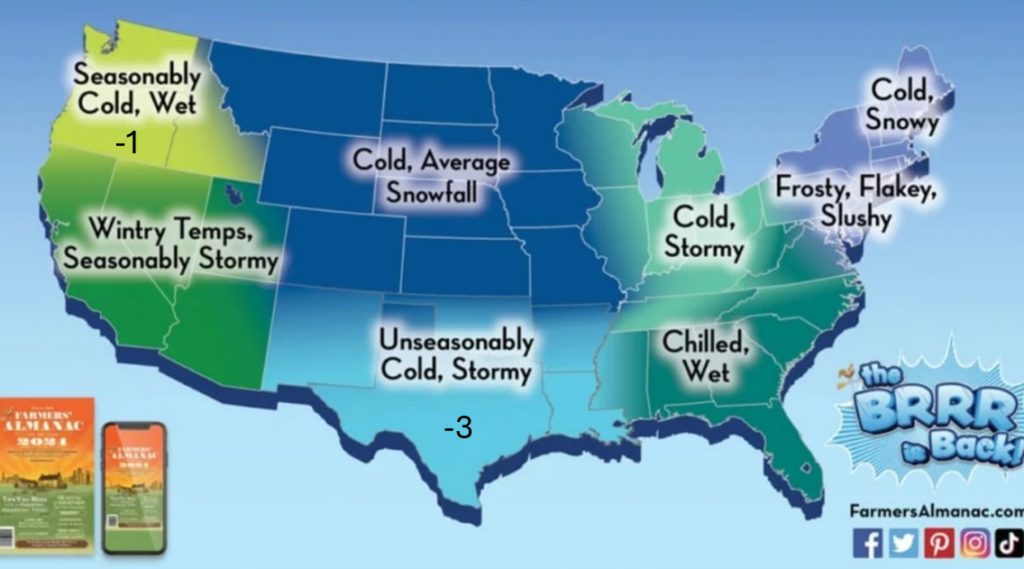
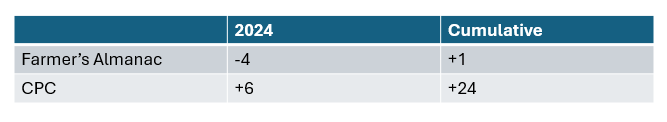
2023-2024: The Farmer’s Almanac only floundered in the final year of competition, calling for ”unseasonably cold” conditions in the South-Central Region (it was warmer than normal: -3) and ”seasonably cold” conditions in the Pacific Northwest (also warmer than normal: -1).
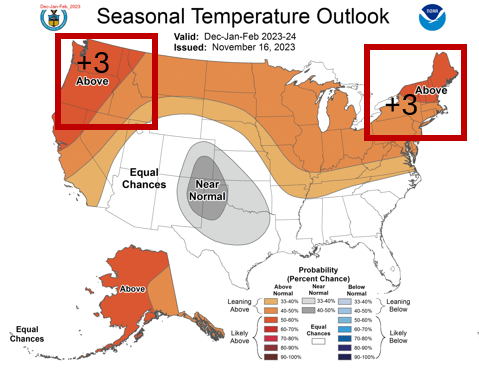
Winter 2023-2024 brought El Niño conditions for the first time in the five-year competition. Meanwhile, Atlantic Ocean temperature anomalies remained high. The CPC used these facts in tandem to confidently call for increased chances of above normal temperatures across the northern United States and above normal precipitation in the southeastern United States. CPC had a very good year, and had the Farmer’s Almanac made more testable claims about temperature and precipitation, it could have scored as high as +12 or +15. However, the call for increased chances of above normal temperatures in the Pacific Northwest and Northeast both verified, and can be counted using our methodology above for an additional +6.
All things considered, the National Weather Service Climate Prediction Center blew out the Farmer’s Almanac over our last five years of winter temperature and precipitation predictions. The CPC came away with a final score of +24, and the Farmer’s Almanac came away with a score of +1 where the expected value for both entities using random number generation would be 0.
The CPC shined in the Great Lakes Region, netting +9 points in over five years. Some of the CPC’s totals could have been higher if we were not enforcing that the CPC only be evaluated on the same number of regional forecasts/year as the Farmer’s Almanac. The CPC did not shine everywhere. The CPC net zeros points in the Pacific Northwest, which was worse than the Farmer’s Almanac (+3), and zeros points in both the South-Central and Northeast Regions (tied with the Farmer’s Almanac). When we look at individual regions, five years is a small sample size, so I would not recommend Seattle residents pick up this year’s copy of The Almanac today. The North-Central Region was also tricky for the CPC because it is a large, diverse region, and seasonal forecasts rarely leaned confidently one way or the other across the region. In some cases, there was an increased probability of above normal temperatures in the south end of the region, and below normal temperatures in the northern end of the region, or vice versa.
The CPC’s score of +24 was greater than that of over 99% of 10000 simulations using random number generation, so we can say with confidence that the CPC is better at forecasting winter temperature and precipitation than random forecasting. The Farmer’s Almanac score was only better than about 55% of 10000 random number generation simulations. We cannot reject the hypothesis that the Farmer’s Almanac makes winter forecasts equivalent in skill to picking randomly. This is the outcome I expected given the tools and resources these two entities use to make their predictions.
Seasonal forecasting is an ongoing challenge in the scientific community. For many stakeholders, significantly better than random chance is simply not good enough. More precision is often needed for stakeholders to make changes to their operations based on a forecast (e.g. farmers planting different crops, ski resorts extending snow making operations). I still understand why the Farmer’s Almanac is popular. It is entertaining. However, if you are considering making decisions based on a seasonal forecast that have any real economic consequence, I strongly suggest deferring to experts like the Climate Prediction Center.