|
|
Drought Early Warning System June 30, 2020 |
|
Temperature Anomalies ![]()


Temperature maps are updated daily and are provided by the High Plains Regional Climate Center.
Evaporative Demand Drought Index ![]()

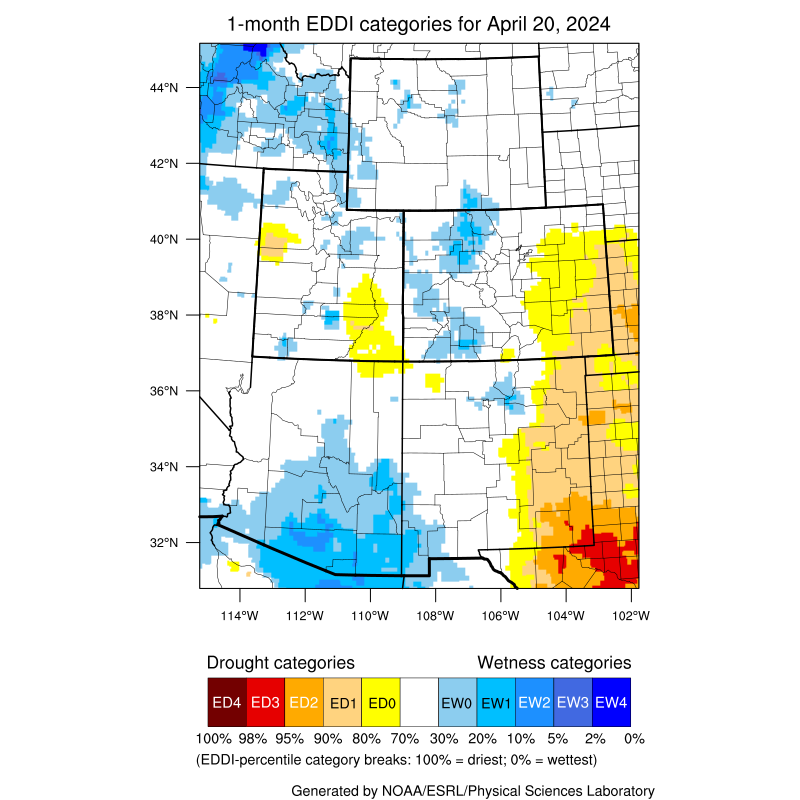

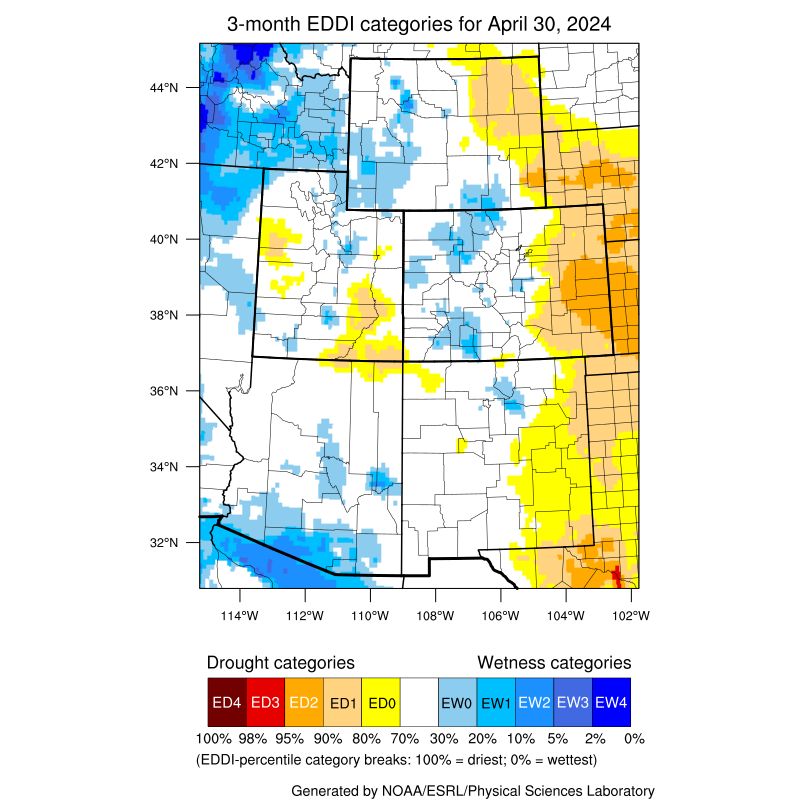
NOAA's Evaporative Demand Drought Index (EDDI) is currently an experimental product. Contact Mike Hobbins for more information. Maps are updated weekly.
Reference Evapotranspiration ![]()
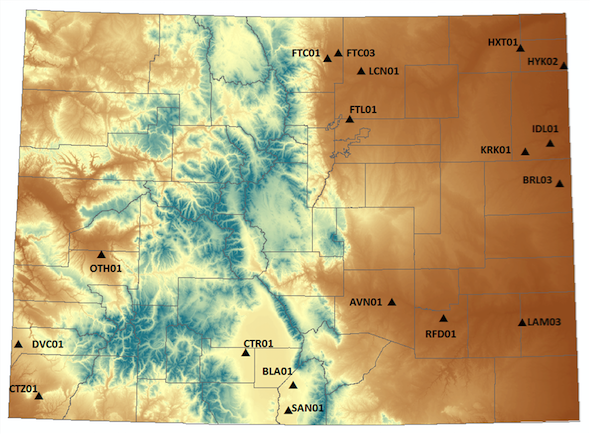
The above map links to graphics for long-term CoAgMET sites across Colorado. Graphics are produced by the Colorado Climate Center and are typically updated weekly, April - September.
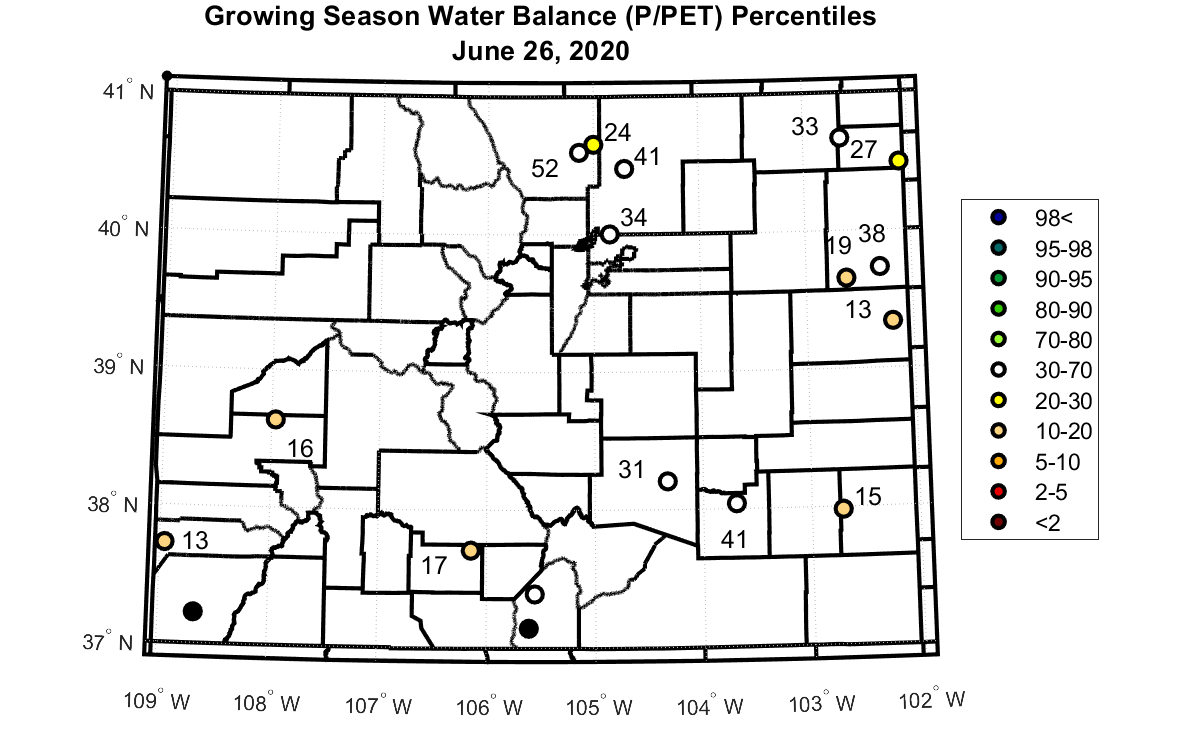
Water Balance