


Last week, from Wednesday, October 21 into Sunday, October 25, southern Colorado—along with neighboring areas of New Mexico, Utah, and Arizona—received widespread heavy rainfall. Thankfully, as of this writing no fatalities or significant injuries have been reported from the resulting flooding, but the destruction has been immense. Roads have been washed out throughout the region, homes have been damaged, water rescues were needed, and recreation areas have been affected. [The Colorado Sun has been doing great reporting on the flood impacts, as has the Navajo Times for areas downstream on the San Juan River. Jonathan Thompson at the Land Desk summarized where the streamflow ranked on various rivers.] Here, we’ll look at the rainfall that led to the flooding, and make the case that this rainstorm wasn’t just unusual for this part of Colorado, but should be considered among the most extreme storms in state history.

Extreme rainfall and floods in southern Colorado
There is a history of heavy rainstorms in the fall in southern Colorado, typically with a connection to the remnants of tropical systems in the eastern Pacific Ocean. The “Sonora hurricane” of October 1911 was one such storm, which led to the flood of record on the San Juan River and other rivers in the region. Just last year (2025), a similar weather system produced major flooding in southwestern Colorado. That event, which we covered in a couple of blog posts last October, was a one-two punch of moisture from a pair tropical cyclones. Even earlier this fall, the remnants of Tropical Storm Polo moved through the southwestern US and brought heavy rainfall and flooding. But by at least some metrics, the recent late-October storm appears to have topped all of these, especially in the lower-and middle elevation areas of southern Colorado.
The meteorological setup for this event was slightly different from those past cases, which had a more direct influence from the remnant tropical cyclones. The late-October event did have some influence from Tropical Storm Trudy, which formed and moved northward toward the west coast of Mexico in mid-October. Trudy then dissipated and never continued on into the US. However, some of the moisture associated with Trudy, along with generally increased atmospheric moisture in the Pacific related to El Niño (more on that later), was transported northward by a very strong trough of low pressure that approached the US West Coast. So even without a direct influence from a tropical cyclone, a sustained “firehose” of water vapor was aimed at southern Colorado.
How much rain fell, and where?
In terms of the total rainfall accumulation, the highest amounts were observed around the San Juan Mountains in Colorado and New Mexico, and the Abajo Mountains in southeastern Utah. Up to 8 inches of rain fell in four days at high elevations, with widespread observations of 4-6″ at lower elevations (first map below). Where the rain amounts were most unusual, however, was in the San Luis Valley. Remember that the San Luis Valley is a very dry place: the average annual precipitation is only 7-9″, and getting more than an inch of rain in a single storm is extremely rare. The San Juan Mountains to the west intercept any moisture that heads toward the valley, making a very effective rain shadow. The second map below shows that the entire San Luis Valley received more than 4 times their usual October precipitation in four days. The amounts may not look big (2-4 inches), but this type of rainstorm just doesn’t tend to happen!
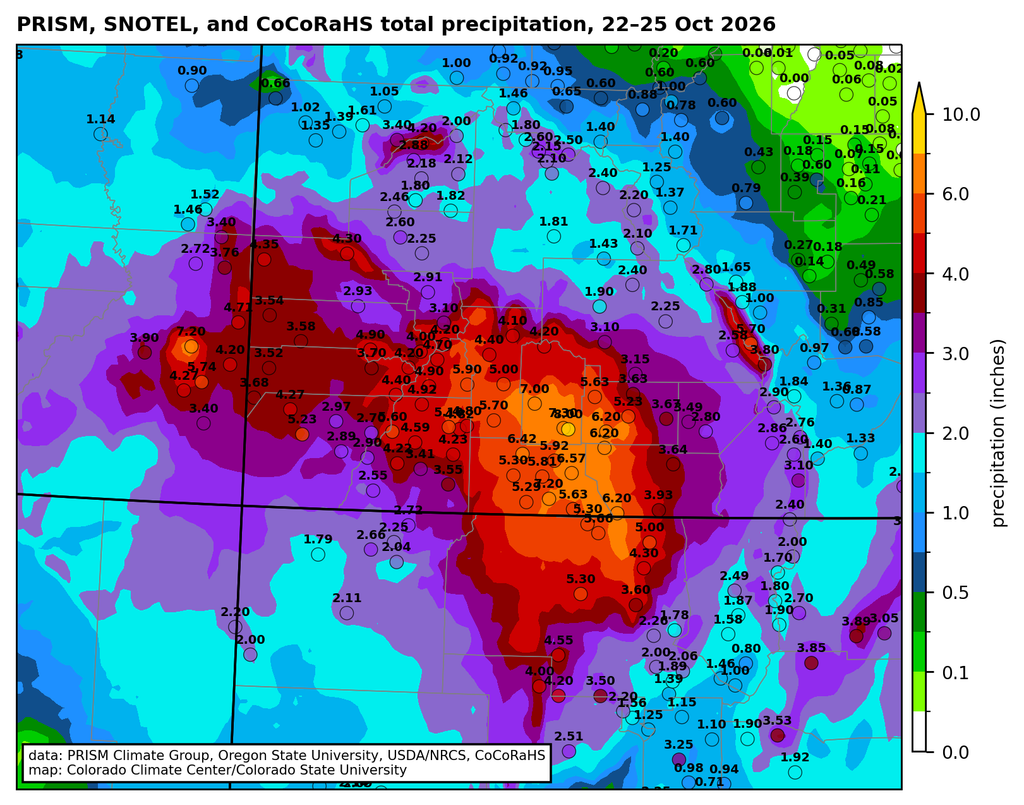
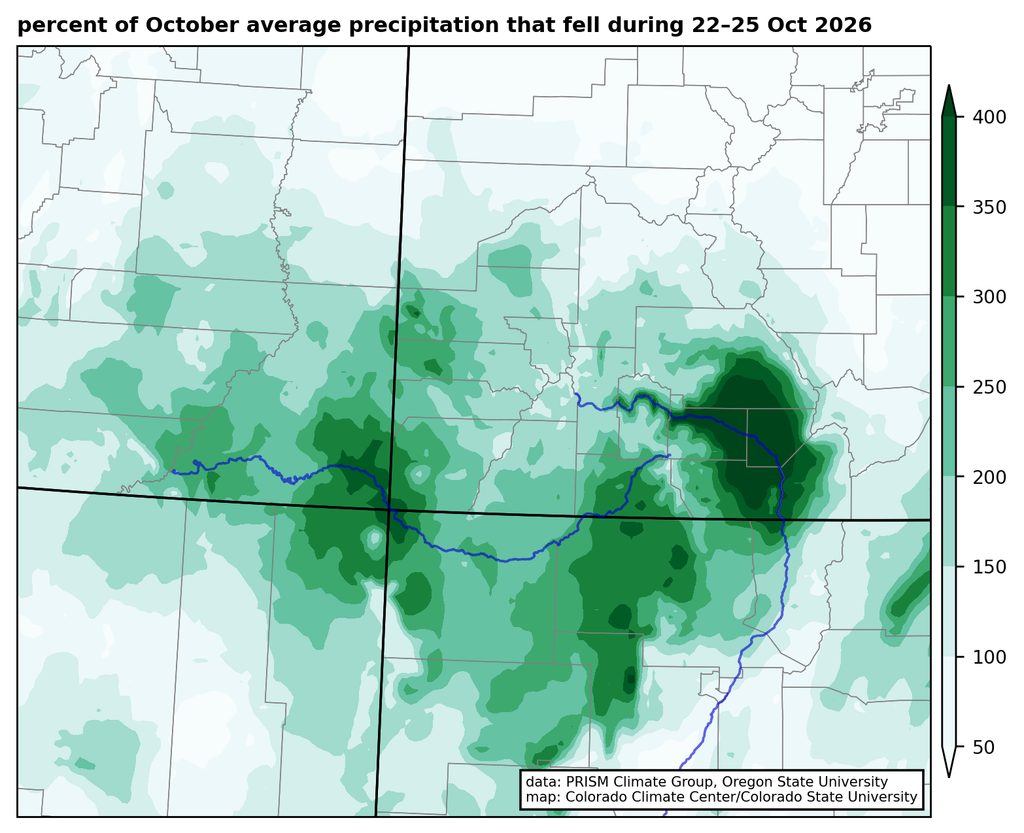
Several stations in the San Luis Valley with climate records extending back 100 years or more had their wettest two-day period on record, including Alamosa, Monte Vista, and Del Norte. (Alamosa and Monte Vista also had their wettest 3-day period.) One way to illustrate how rare a rain event is for a given area is through precipitation frequency analysis, which estimates the probability of a given amount of rain falling in any year. These are often converted to average recurrence intervals (ARIs), so that a storm with a 1% chance of happening in any year is referred to as a “100-year” storm. That terminology can be misleading, because it doesn’t mean that such a storm can’t happen again for another 100 years: it’s just an average. We’ll use that terminology here because it’s simpler, but keep this caveat in mind1.
We see below that for the two-day period from Wednesday morning (21st) to Friday morning (23rd), 2-6 inches of rain fell across southern Colorado. For much of the region (light red shading on the right map below), these two-day totals represented at least a 10-year rainstorm; in parts of Archuleta County and much of the San Luis Valley it was a 100-year rainstorm, and in several parts of the SLV it was more than a 1000-year storm.
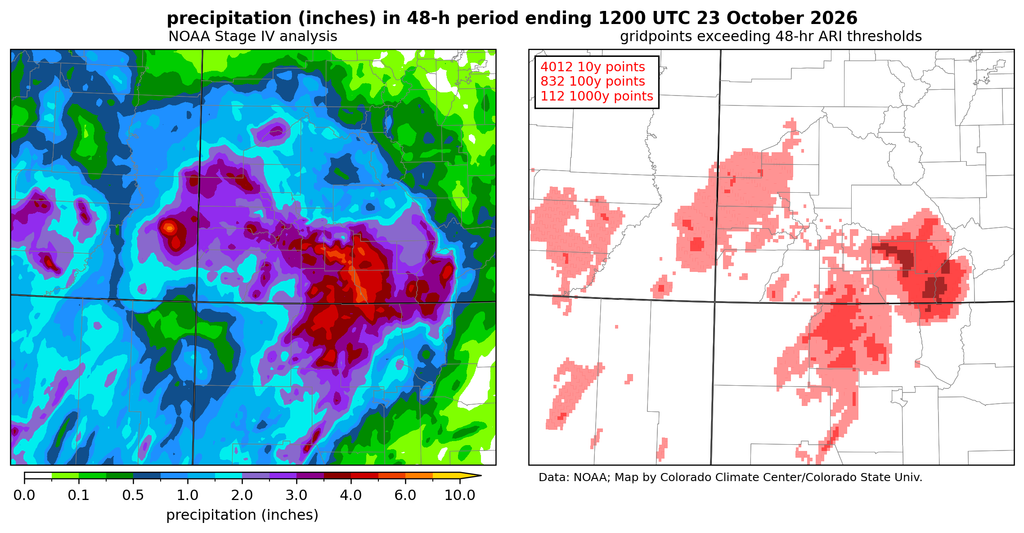
I want to highlight one observation in particular, from South Fork, Colorado, where the South Fork of the Rio Grande merges with the main stem of that river. A CoCoRaHS volunteer observer reported 4.46″ of rain in two days, which is an astonishing amount of rain for that location, with less than a 1 in 1000 chance of happening in any given year, based on available statistics. Unfortunately, the flood damage in South Fork was significant, including at the Fun Valley Family Resort. That observer recorded another 1.15″ of rain on the 25th, for a 4-day rainfall total of 5.64″

[I want to take a moment to give a word of huge appreciation to the CoCoRaHS volunteer observers throughout the region, and to particularly point out the observers around Pagosa Springs. That community has now seen two major floods in two years, and the incredible volunteer network, many of them recruited by the Pagosa Weather team, has collected a remarkable dataset documenting the details of both of those storms.]
How did the rainfall compare to last October’s storms?
The map below compares the 4-day total rainfall from the recent event to the totals from the wettest 4-day period in the storms last October. In the San Juan and Rio Grande watersheds, this year’s event had considerably more precipitation. In the San Luis Valley and extending into Archuleta County and northern New Mexico, 2-4″ more rain fell in this year’s storm. The exception was at the highest elevations of the San Juans and in La Plata County, where the October 2025 storm had more precipitation. At least part of this was because last year’s event was effectively all rain, whereas the high peaks were getting snow in this year’s storm. The flood peak on the San Juan River at Pagosa Springs was more than 2 feet higher in October 2026 than in the 2025 flood.
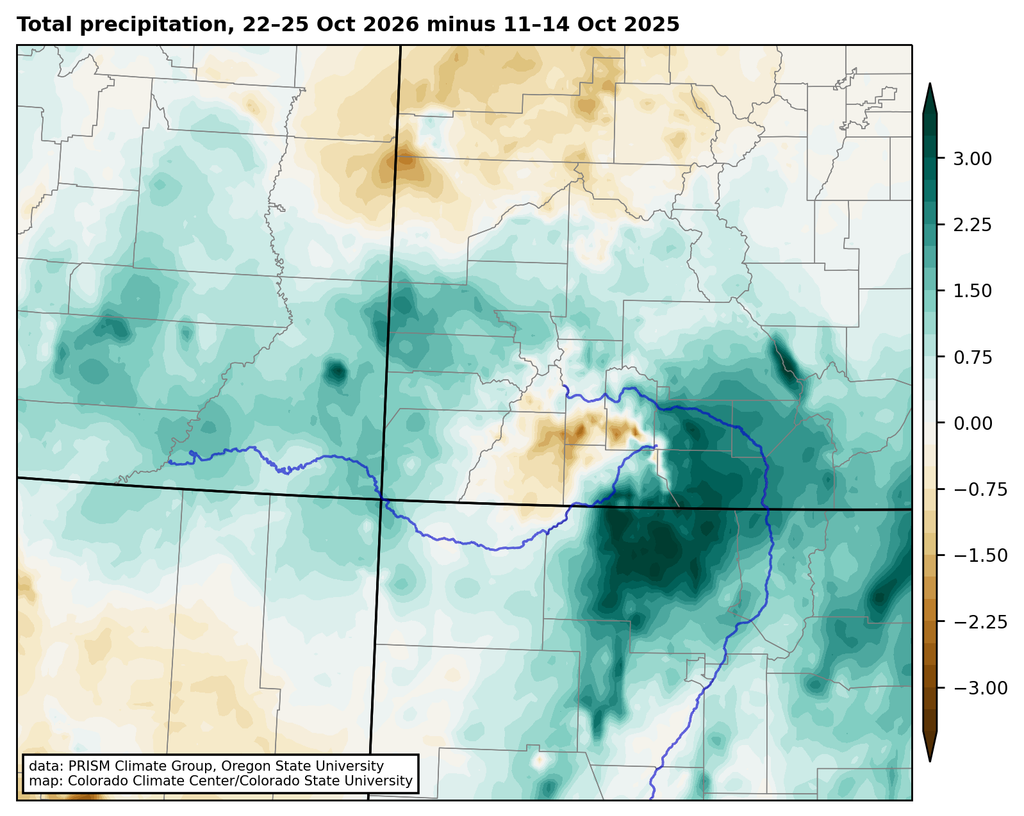
If we compare the “1000-year rainfall” in the October 2026 storm to past events like the September 2013 Front Range floods, this year’s storm remarkably had even greater coverage of very rare rainfall amounts. Although the total amount of rainfall may not have been as great, considering the records broken and the spatial coverage of rainfall that was extremely rare for the locations where it fell, the October 2026 storm in southern Colorado should clearly be added to the list of the most extreme rainstorms in Colorado history. Trying to rank those storms would be very difficult, but such a list would surely include the October 1911 “Sonora hurricane” rainfall, the June 1921 storm that flooded Penrose and Pueblo, the May 1935 storm that caused the Republican River flood, the June 1965 storms in both northern and southeastern Colorado, the 1976 Big Thompson storm, the September 2013 “Great Colorado flood“, and now the October 2026 event in southern Colorado and neighboring states.
What did the storm mean for the drought?
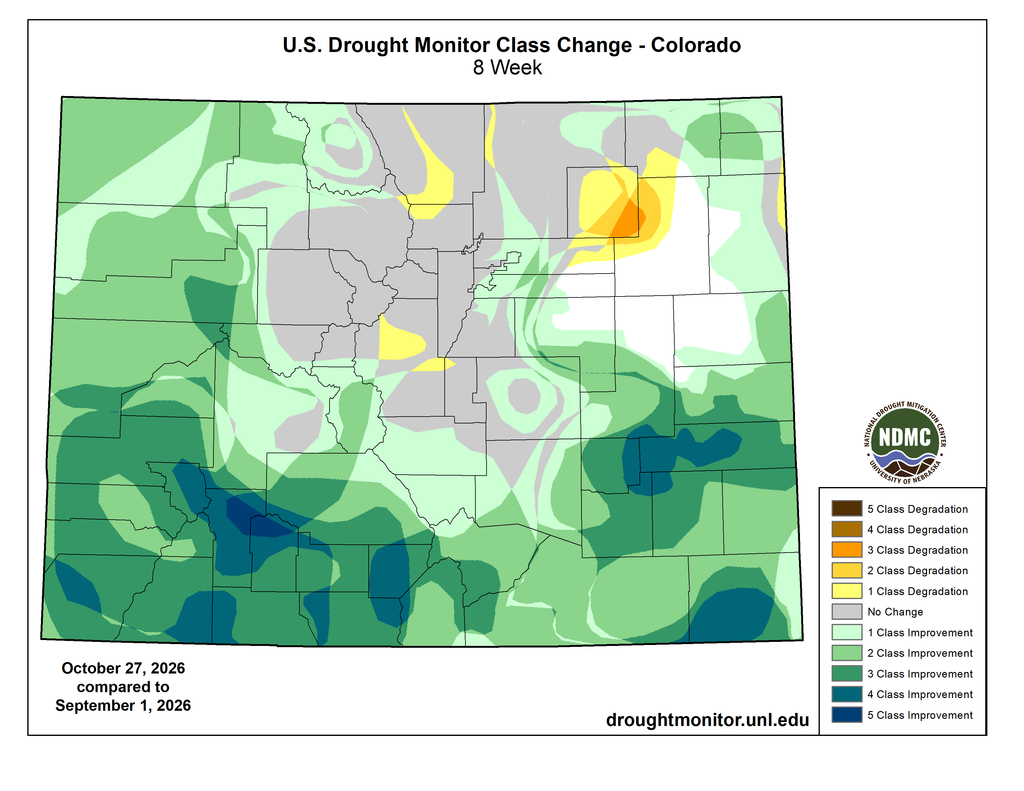
The flip side to all of the flood damage is the benefit to the drought and water supply situation. Going back to the beginning of September, much of southern Colorado has had record-high precipitation, after a brutal snow season and a hot, dry summer. The persistent heavy rain has led to major improvements in drought. Much of southwestern Colorado is now drought-free on the US Drought Monitor, with 3 to 5 category improvements over the last two months.
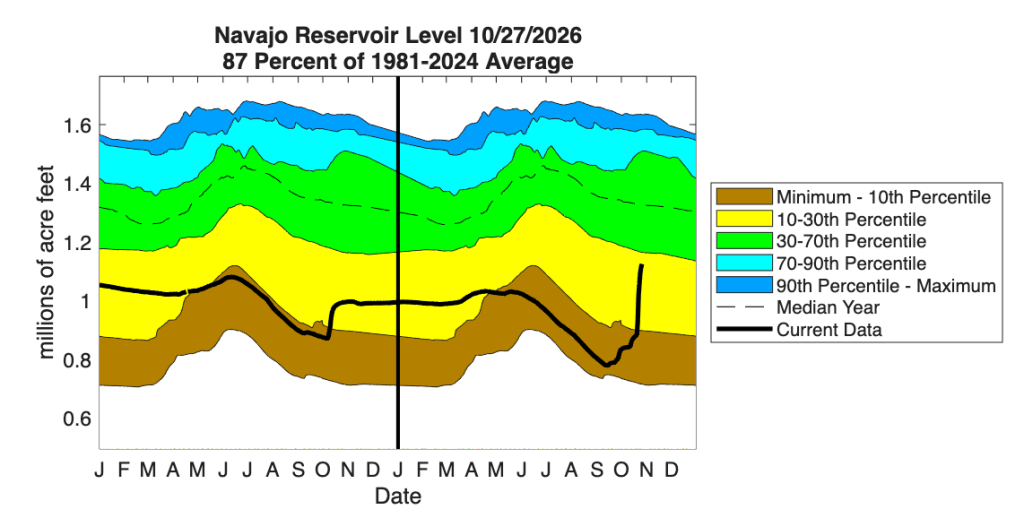
Rivers in southern Colorado that were near record-low flows in the summer are now near record high flows for the fall. Some reservoirs have seen significant increases in storage as well, particularly Navajo Reservoir on the San Juan River, just across the border in New Mexico. That reservoir saw essentially no increase from snowmelt in the spring and summer, and was nearing record low levels as of early September; the recent storms gave it a huge and much-needed boost. My colleague here at the CCC Peter Goble calculated that from October 22 to 25, approximately 884,000 acre-feet of water fell just in Mineral, Hinsdale, and Archuleta Counties. And going back to the start of the rains in early September, that number would be even bigger.
Farther downstream on the Colorado River, Lake Powell has also seen a noticeable boost in storage, such that it is no longer at a record low. But this is important perspective to keep in mind: even with all the rain, it just gets Powell storage to “not quite record low”. Other important Colorado reservoirs farther north, like Granby and Blue Mesa saw much less precipitation and very little increase in storage from recent storms. Going straight from flood to drought to flood might look something like “average” precipitation, but it isn’t the preferred pathway to get that water. And having a lot of rain in the fall doesn’t undo the damage that was done from the drought earlier in the year (impacts to recreation, agriculture, wildfires, and on and on). So, the drought relief is substantial and welcome now, but we still need a good mountain snow season to improve the situation across Colorado and the southwestern US as a whole.
Where does El Niño fit in to this story, and what’s coming next?
As Peter outlined in this post, the fall season is when we see some of the most robust connections between El Niño and precipitation in Colorado, with falls tending to be wetter than average in southern Colorado during El Niño. It is quite remarkable how closely this fall’s precipitation patterns thus far match the historical correlations: on the figure below, look at how similar the green shading in the map on the left is to the areas that have seen above-average precipitation this fall!
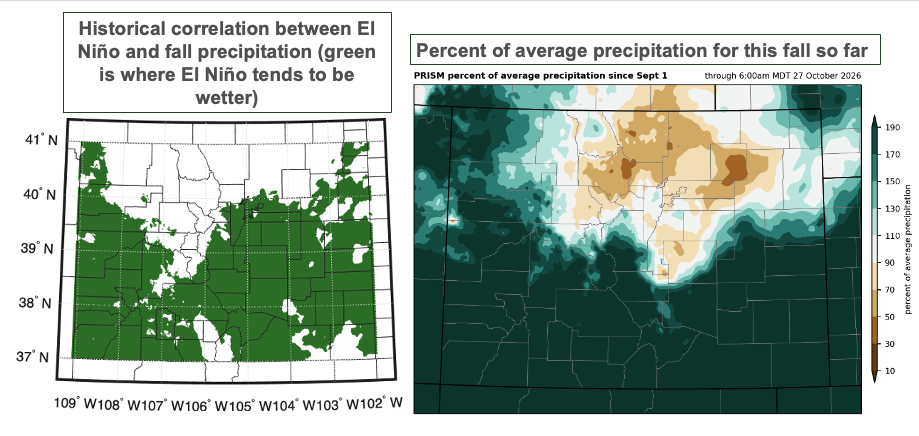
El Niño years, with warm ocean temperatures in the eastern Pacific, tend to allow for more moisture to be transported into southern Colorado in the fall. El Niño years also tend to have more hurricanes in the eastern Pacific (this has very much been the case this year), which increase the chances for extreme rainstorms like the ones we’ve seen this fall. So there’s a pretty clear fingerprint of El Niño on this fall season. And, for both better and worse, it’s not going to slow down: another storm will affect southern Colorado this weekend, bringing more water for drought relief, but also more flood risk to the areas that have already been hard-hit. (Sunday, November 1 will see the greatest risk of more heavy rain and flooding, as well as snow at the high elevations.)
Unfortunately, the picture gets murkier as we look beyond that into the main mountain snow season. Although the fall (and spring) seasons tend to be wetter during El Niño years, the signal in the core of winter is not as strong. A big snow year is certainly one possible outcome, but is by no means guaranteed.
- Another caveat is that the rarer the precipitation amount, the less certain the recurrence interval estimates are. NOAA’s Atlas 14 and the Colorado-New Mexico Regional Extreme Precipitation Study provide uncertainty estimates around the calculations. Here we’re using the ‘most likely’ value from those calculations. ↩︎
 Allie Mazurek
 Peter Goble