


Apologies that the blog has been quiet for a while. We’ve had a lot going on, including hosting the American Association of State Climatologists annual meeting in Fort Collins in mid-June. What happened in the meantime?
May turned active in terms of severe weather, especially hailstorms that affected Yuma, Greeley, and the Denver metro area. There was also a big snowstorm in mid-May in the central mountains that brought the snowpack back up in areas where it started melting early, especially the Arkansas River basin. The Arkansas ended up having high peak flows as a result. You can read more about May conditions in our May monthly summary.
We also just released our June monthly summary. (If you aren’t subscribed, use the link at the top of that page. And while you’re at it, get alerted to new blog posts using the box here on the blog page — they are two separate mailing lists.)
The main message from June is that it was warm across all of Colorado. In fact, it was the 3rd-warmest June when averaged across the state. Only the Junes of 2002 and 2012 were warmer.
2002 and 2012 might ring a bell, as they were summers with major wildfires across Colorado. The big difference between those Junes and 2024 was that the mountains and western slope were not only warm, but also rainy this year. That is a very unusual combination in summer. This is clearly illustrated by the “quadrant chart” for Grand Junction in June. These plots show temperature on the horizontal axis and precipitation on the vertical axis for all years in the record. The data then show up in quadrants, with the upper right being the “warm and wet” quadrant.
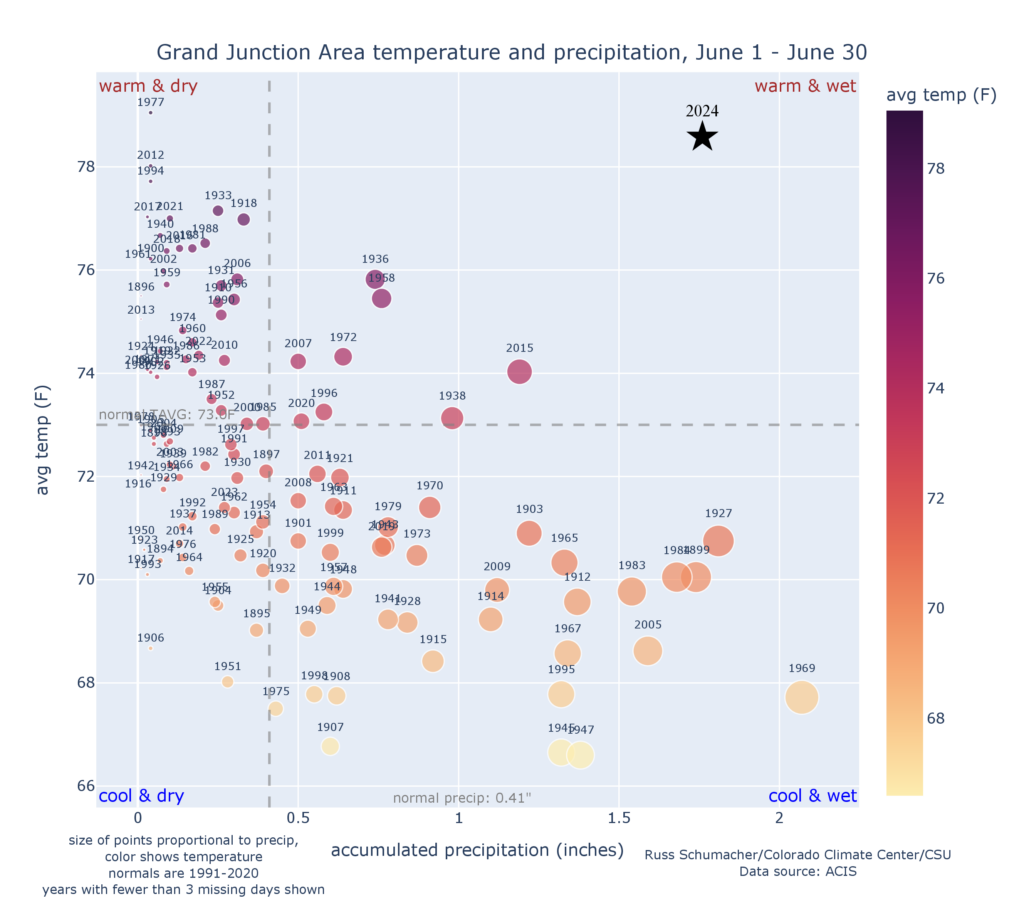
You can see that June 2024 was unlike any other June in the record at Grand Junction. It was the 2nd-warmest and 3rd-wettest June. Most of the other really warm Junes were also quite dry. These charts for June 2024 look similar at many other stations around southern and western Colorado. If you’re interested in exploring more of these quadrant charts, there are interactive versions for Colorado’s climate divisions and over different time periods on our Climate at a Glance page.
Check out more June statistics in the monthly summary. And the big topic of discussion now is the impending heat wave for the weekend of July 12-14. Along the Front Range, it has the potential to rival other historic heat waves like those in 1954, 2005, and 2012. We will take a look next week at what records end up being broken, and where the heat wave fits in historical context.