


Recent Temperatures
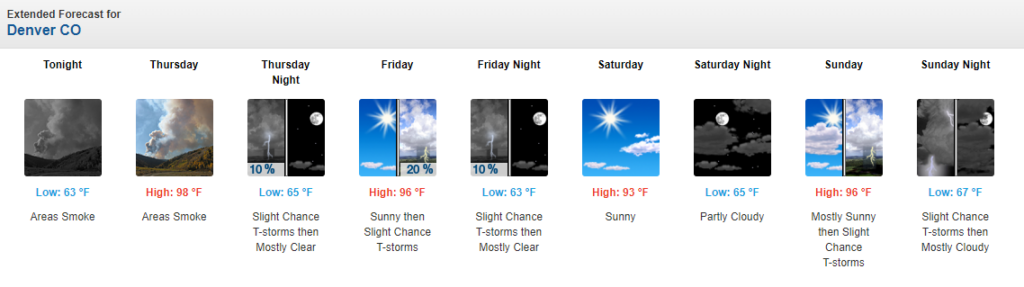
Colorado is currently in the throes of yet another heat wave. Many daily temperature records and some monthly temperature records will be threatened this week across northern and central Colorado. We will see temperatures flirting with the triple digits up and down the Front Range and Urban Corridor. The image below of the National Weather Service 5-day forecast for Denver shows persistent mid-to-upper 90s.
Just earlier this month we saw a heat wave that threatened all-time high temperature records across the state (July 12th – July 14th). The details of the last heat wave can be found in our last blog. For this blog I thought it would be fun to explore heat waves in a bit more detail. First, we’ll examine some of the record heat from around the state. Then we will explore all the factors that need to come together to produce record heat.
Records Around the State
Most of the population centers in Colorado have all-time high temperature records between 100 °F and 110 °F. Records on the Urban Corridor from Fort Collins down to Colorado Springs range from 101 °F to 104 °F. Pueblo gets a bit hotter, with a record of 109 °F. The terrain in western Colorado is extremely complex, and so are the high temperature records. Areas in the valleys such as Grand Junction and Montrose have seen temperatures max out at values a little bit above the Front Range (107 °F and 106 °F respectively). The hottest temperatures ever recorded in Colorado have occurred on the Eastern Plains, with records from 109 °F to 115 °F in Las Animas; this is our state record. People travel from far and wide to enjoy our Colorado mountains in the summertime, and one of the biggest reasons is the thinner, cooler, drier air. Record high temperatures in the mountains are much cooler. Dillon, CO in Summit County has famously never experienced a 90-degree day. Maximum temperature records only get cooler as one travels higher in elevation. The figure below shows record high temperatures across the state. For the sake of comparison, I have also included the maximum temperature record of 80 °F at Slumgullion Pass, which sits at 11,300 feet elevation.
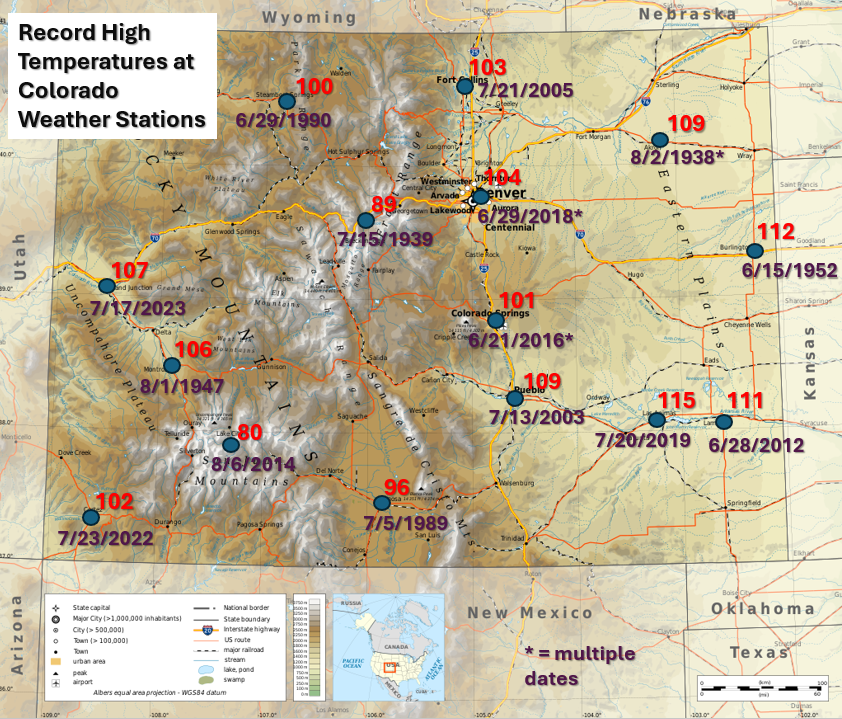
We see in the figure above an obvious relationship between the maximum temperature record observed at a station and elevation. It is much more difficult to see extremely high temperatures in the thin mountain air than in the relatively think air over the eastern plains. This probably feels somewhat intuitive, but can we explain why this is using physics? Why can’t the mountains get as warm as the plains? Why are some summers hotter than others, and why are some heat waves worse than others? The remainder of this blog is devoted to examining the anatomy of a heat wave in detail, and understanding what weather forecasters might be looking for when forecasting in the heat of summer.
Anatomy of Hot Temperatures – What causes the hottest weather on record, or even the hottest weather of the year, and how can forecasters see it coming? To produce the highest possible temperatures, we need several factors to come together: we need the right time of day, the right season, the right large scale atmospheric pattern, stable enough air, and the right microscale conditions. Let’s explore all of these factors!
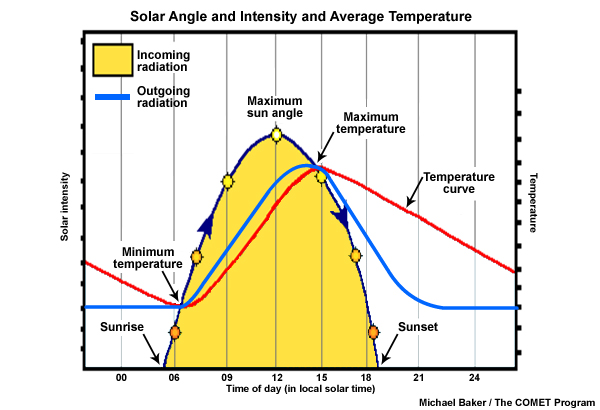
Time of day: Of course our hottest temperatures occur during the daytime when the sun is out, but how come the heat of the day occurs in the mid-to-late afternoon when the sun is shining most directly on us at noon? Whether or not the surface temperature is increasing or decreasing is determined by whether the earth’s surface is gaining more energy than it is losing. The energy input from the sun will be greatest at noon, but energy inputs continue to be greater than outputs throughout the afternoon, so the temperature continues to rise. This effect is shown in the figure below, which comes from a University Center for Atmospheric Research COMET module. The yellow curve shows the intensity of the sunshine throughout the day. The blue curve shows outgoing radiation, or how much energy is trying to escape from the earth’s surface out to space. As temperatures rise, this number goes up. You can think about it as the earth is “trying” to cool down. The red curve shows temperature throughout a typical day. If the yellow curve is above the blue curve, the temperature increases. If the blue curve is above the yellow curve, the temperature decreases. The maximum and minimum daily temperatures occur at overlapping points.
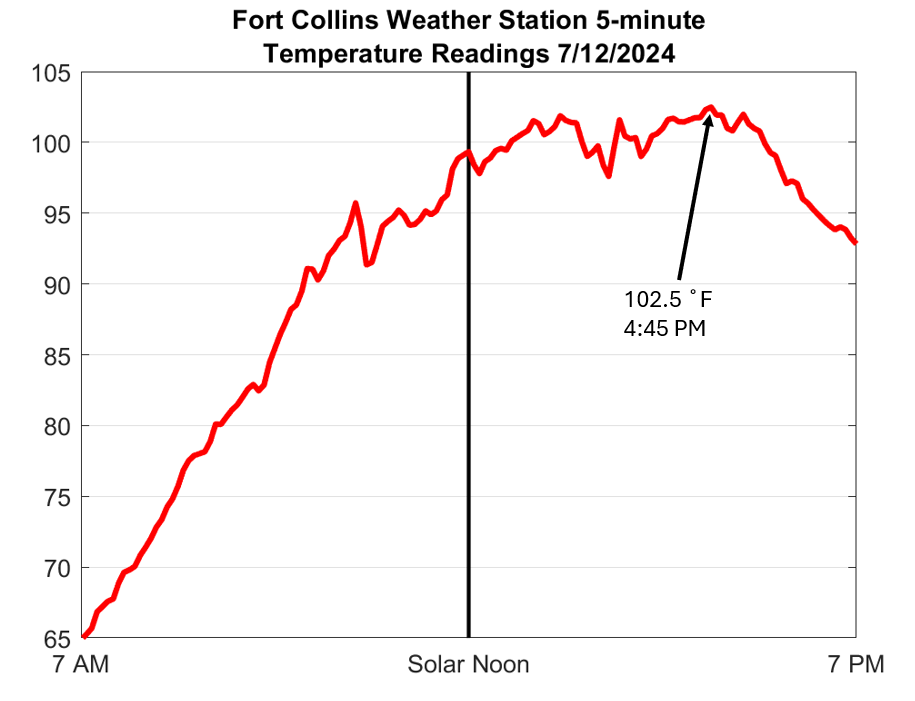
If you live in Colorado, summer temperatures will probably top out some time between 3:30 and 5:00 PM in summertime. This is 2:30-4:00 in standard time, or approximately 2.5-4 hours after solar noon. We can see a good example of this using the Fort Collins weather station from our last heat wave on July 12th, 2024. The temperature climbed rapidly throughout the morning, becoming close to 100 °F by 1:00 PM MDT (12:00 PM MST, solar noon), and then slowly continuing to creep upward (with small fluctuations) for the next several hours. As late afternoon approached, the energy input from the sun could not keep up with the energy output from the earth’s surface and the temperature began to fall.
Season: We all know summer is the hottest time of year, and most of us intuitively understand why: the days are longer and the sun shines more directly on the land surface during the day. We can put a little bit of math behind this intuition. When the sun shines from directly overhead, it sends 1366 Watts/meter squared of radiative energy though the top of the atmosphere. Some of this energy will be reflected or absorbed before hitting the earth’s surface, but on a clear sky day most of it will be absorbed by the land surface, and in turn, rapidly heat up the near surface atmosphere. The sun’s energy is not truly “constant,” it fluctuates based on sunspot cycles. For the moment, let’s just call maximum output from the sun 100%, and the amount of energy we get from the sun at night 0%.
The fraction of the sun’s energy that reaches the earth’s surface is a function of angle: how high is the sun in the sky? When the sun is directly overhead it is intense and beats directly down on the land surface. When it is on the horizon the energy is diffuse, hitting with a glancing blow. The earth’s tilt is 23.5 degrees, so in the northern hemisphere, we tilt a maximum of 23.5 degrees toward the sun in the summer and 23.5 degrees away from the sun in the winter. This means if you live in Boulder, Colorado, which sits right on the 40th, parallel, the sun will be 40 degrees south of directly overhead at midday on the spring and fall equinoxes, but 63.5 degrees from directly overhead on the winter solstice, and only 16.5 degrees from directly overhead on the summer solstice. We can take the cosine of these angles to see that the sun provides 77% of its maximum energy in Boulder at noon on either equinox, only 45% on the winter solstice, and 96% of its maximum energy on the summer solstice.
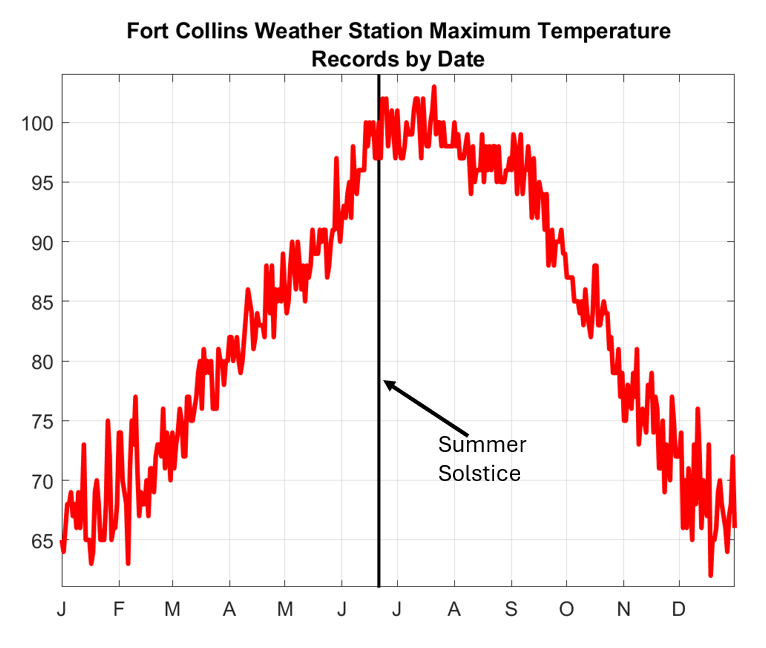
Many of our most extreme heat waves across Colorado, and the country, do occur right around the summer solstice (late June), but may also occur throughout July and August. However, our heat waves are certainly not evenly distributed around the summer solstice. There are far fewer in late May and early June even though we receive more direct sunlight than we do in late July and early August. Why? Much as there is a lag between noon and the hottest time of day, a small lag exists between the longest, brightest days and the peak window for heat waves. It takes the atmosphere several weeks to fully equilibrate, or “catch up” to the increase in sunlight during late spring, making it easier to build “heat domes” later in the summer (more on this below). Furthermore, the land surface also tends to dry out as the summer wears on, meaning a greater fraction of the sun’s energy goes into directly heating the land, and a smaller fraction (on average) goes into evaporating water. All things considered, we end up with the largest threats for triple digit heat, in Colorado, in late June and July. The image below shows the official maximum daily temperature records for the Fort Collins weather station for every day of the calendar year. Our earliest 100-degree day on record is June 14th, and our latest is August 1st.
We now know that the potential for record hot surface temperatures peaks in the mid-to-late afternoon in late June through late July, but can we explain why some days are hotter than others? Yes. The simple answer is we need the right weather conditions. Let’s explore the anatomy of a heat wave from a meteorological standpoint.
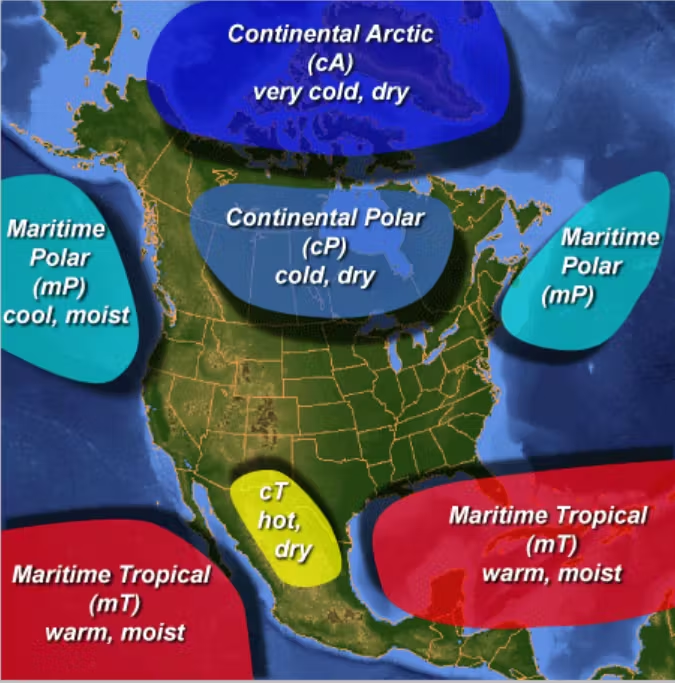
Large-scale weather pattern: What large scale weather pattern is needed to produce heat waves? The short answer is dry air and high pressure, but we think about this in greater detail. We can think of earth’s atmosphere as being made of up airmasses and the boundaries between them. Air masses are large-scale high pressure systems that can be described as warm and dry (continental tropical, cT), warm and moist (maritime tropical, mT), cool and dry (continental polar, cP), or cool and (relatively) moist (maritime polar mP). Low pressure systems and stormy weather occur in the spaces between, where air masses collide with one another. The figure below shows different types of air masses, and where they tend to occur from Canada’s weather glossary.
To obtain the hottest possible surface temperature we need a hot, dry, high pressure airmass to preside over Colorado. The air needs to be dry because moisture in the air can condense, forming clouds and blocking sunlight. If the near surface layer of air is too moist, thunderstorms will form when the air is heated, cooling conditions back down substantially. High pressure is ideal because air expands outward from high pressure centers, which leads to sinking air. Sinking air draws the driest air down from the upper atmosphere to the surface. Why is sinking air important?
Stability: Have you heard the saying “heat rises?” If this is true, how are such high temperatures possible at the earth’s surface? Heat does indeed rise because hot air is less dense than cool air. However, as hot air rises it expands to equilibrate to the lower pressure at higher altitudes. There is an energy cost to air expanding, and because of this, air cools as it expands. When we measure this cooling, we see that rising air cools at a rate of 9.8 °C/kilometer of elevation gain (about 5.5 °F/thousand feet). The air aloft is usually cooler than the air at the surface, but so long as it is not more than 5.5 °F cooler per thousand feet of rise, the hot air at the surface will remain in place. This is why having relatively warm air aloft, and not just at the surface, is so important. If warm air is in place aloft, the air at the surface will have to be even warmer to rise.
Stability is a big part of the reason high pressure atmospheric conditions are ideal for heat. As mentioned above, high pressure forces air aloft to sink. This air is compressed and warmed as it sinks, also at a rate of 5.5 °F/1000 feet. Hotter and drier than normal air above the surface, which is sometimes called a “heat dome,” suppresses the development of clouds and thunderstorms, forces air down from above that warms as it sinks, and lets the surface air bake to its maximum possible temperature under the hot summer sunshine.
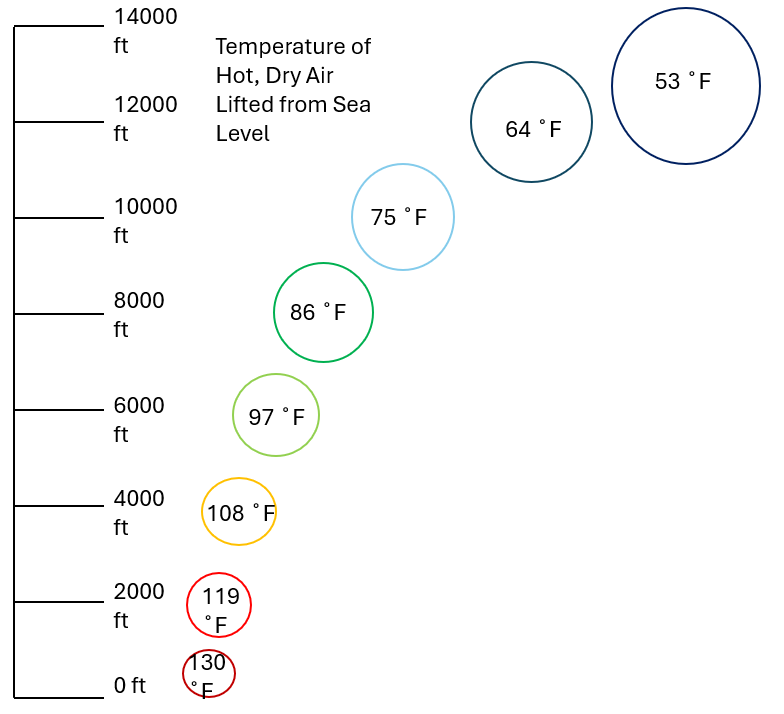
Stability is also why it is nearly impossible to generate triple-digit heat at high elevations. The thin air above our mountain valleys is so reliably cool. In the absence of a “heat dome,” the hot air generated at elevation usually rises and escapes, often triggering thunderstorms. Even record hot air near sea level is surprisingly cool if lifted to the elevations of our Rocky Mountains. For instance, suppose it is hot enough to produce a blistering 132 °F temperature at Furnace Creek in Death Valley. If that air was lifted to 2000 ft elevation, it would be 120 °F. As it happens, 2000 ft is the elevation of Las Vegas, and 120 °F is the all-time record high temperature in Las Vegas. Lift it another 3000 ft and you’re at the elevation of Fort Collins. That same air is now 103 °F. Hey, that is the record high temperature for Fort Collins! As it continues to rise, we hit a mark of 81 °F at 9000 ft (think Summit County) and 53 °F by the time we reach the elevation of Mt. Elbert, nearly 70 °F for just under three miles of vertical displacement.
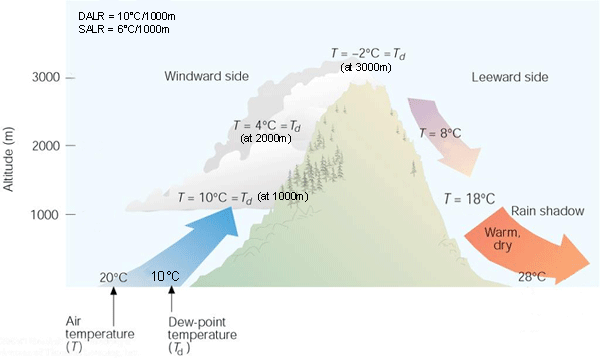
Thunderstorms can play a surprising role in producing heat waves. If there is too much moisture in the atmosphere, then heating up the land surface will generate thunderstorms, and kill any chance of developing record heat. However, thunderstorms that occurred earlier somewhere upstream can be a key ingredient for creating the perfect heat wave. Air in thunderstorm clouds is saturated, and as this air rises, it cools at a rate much lower than 5.5 °F/1000 feet. When saturated air rises the water vapor is condensed into liquid or even ice. This phase change of water from a gas to a liquid or solid releases latent heat of condensation, counteracting the cooling impact of air expanding as it rises. The image below shows an example of how moist air can return to the surface warmer than it started after releasing latent heat.
The amount of latent, or “hidden” heat in moist air is enormous. If a saturated mass of air in the deep tropics was lifted high enough to condense all water vapor out of the air, and then forced all the way back down to sea level, it could be as hot as 200 °F. We never see air this hot because after moist tropical air is lifted, its density will be far too low to force all the way back to the surface. This air will have to cool for weeks if not months before returning to sea level. However, moist air that is lifted and releases its latent heat of condensation, and then is forced by high pressure to sink at least part way to the surface days later, can create a highly effective heat dome. This is what happened in the June 2021 heat wave over the Pacific Northwest. Storm activity over the Pacific Ocean lifted moisture-laden air into the upper atmosphere, releasing its latent heat. The now dry upper-level air traveled eastward until reaching the western United States. A high pressure airmass over British Columbia forced this air back down, creating a brutal heat dome over Washington and Oregon.
Microscale weather pattern: The record high temperature for Denver is 104 °F, but have you ever driven by an area bank sign, or seen a car thermometer, that says 110 °F? Was that reading wrong? Not necessarily. If the sun is shining directly on the thermometer, then yes, it is wrong. Official temperature readings are taken in thermometer shelters, which are ventilated, but shaded (example below).
If the thermometer is sited in a place with large amounts of asphalt/concrete/steel (e.g. downtown in a large city/Walmart parking lot) it may indeed be that hot! Long-term weather stations are supposed to be sited in more open spaces surrounded by native vegetation. If the temperature was 100 °F at a close by weather station maybe it was 109 °F where you parked your car. This is a well-known concern in large cities. All the concrete and steel and lack of green area traps heat, creating an “urban heat island.” The added heat in structure-dense cities is a major health and human safety concern in many metro areas around the country.
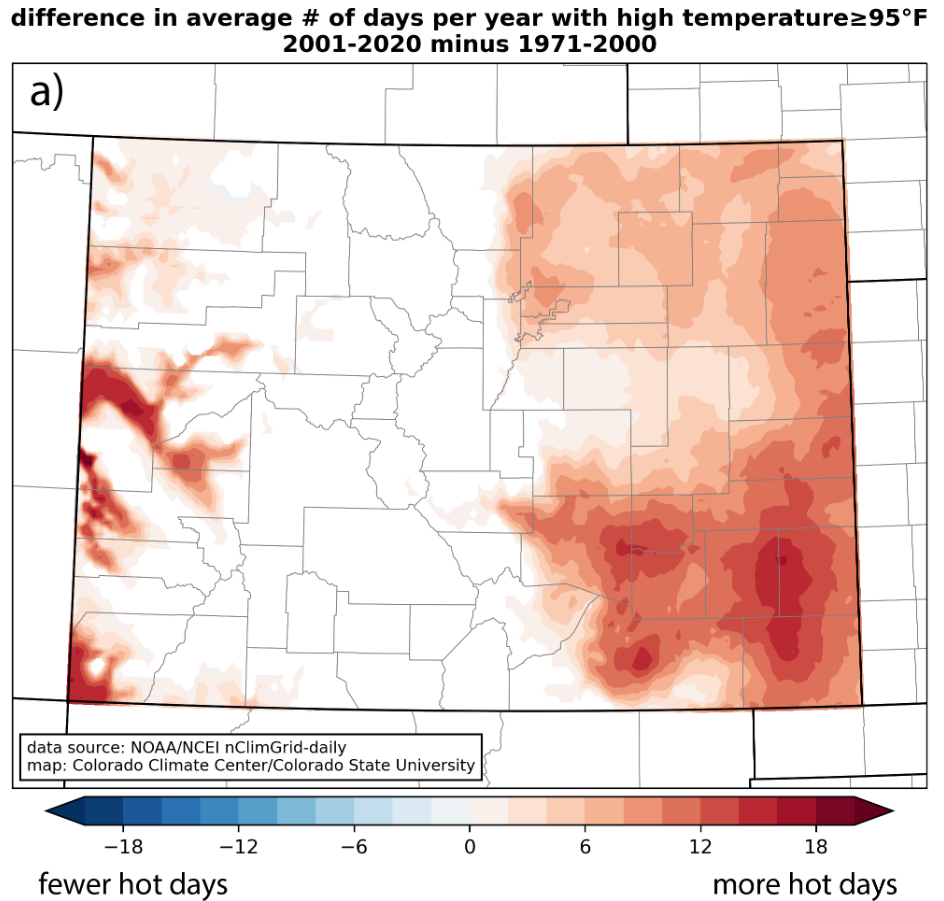
Climate change: To quote a recent article on heat waves by Dr. Andrew Dressler “a rising tide floats all boats.” More heat in the atmosphere means a higher upper bound on how hot temperatures can get. That said, while we are seeing significant increases in the number of hot days (figure below) we are not seeing such obvious movement in record high temperatures.
Conclusion: All things considered, when will you see record heat, and why? 1. Record heat will likely occur in the mid-to-late afternoon immediately after the day’s peak heating hours. 2. Record heat will probably occur in late June or July. August is hot, but the days are already getting shorter, and the intensity of the midday sun has already begun to wane. 3. The air and land will be dry. In Colorado, it is almost impossible to heat humid air to triple digits without clouds forming, and possibly thunderstorms. 4. The surface pressure will be high, which draws dry, compressed air down from the upper atmosphere at seals in warmer conditions. 5. The air above the surface can likely be traced back to thunderstorm activity somewhere else. The latent heat release from these storms is contributing to the heat dome over your head. 6. If a new record occurred at your local long term weather station, it was probably even hotter downtown and on the roadways.