


For those who were on Colorado’s Front Range in 2003, the epic snowstorm in mid-March likely still holds a place in your memory. This was the biggest snowstorm on record at Fort Collins, with 32.2″ of snow in two days on March 18-19. Denver’s 32″ of snow is 2nd only to the 41.3″ in four days in December 1913. There were multiple reports of over 70″ of snow in the foothills around Nederland and Conifer.
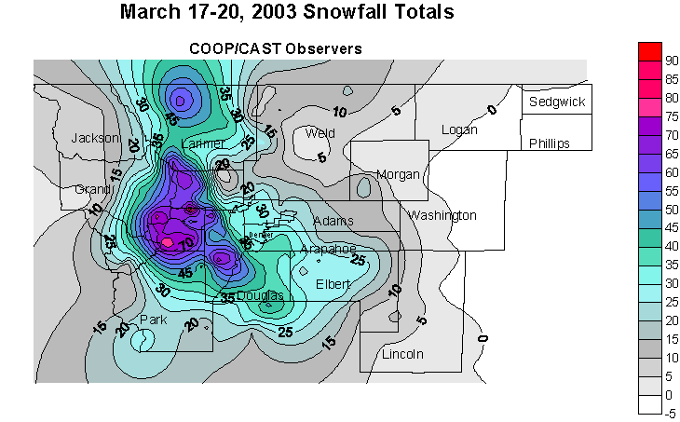
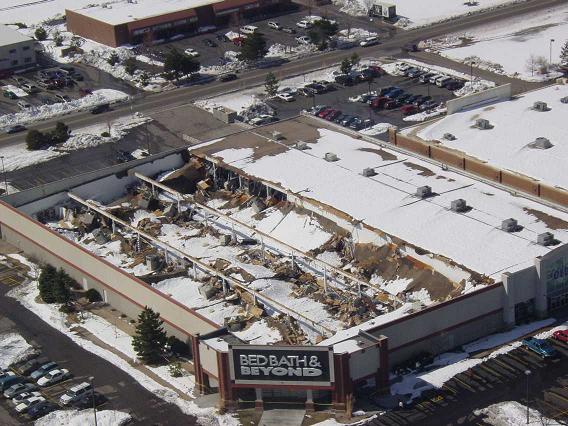
The March 2003 storm was also known for very wet snow. Fort Collins received 5.29″ of liquid precipitation over three days, which is in the top-10 wettest 3-day periods and easily the wettest snowstorm. The roofs of multiple commercial buildings caved under the weight of the heavy, wet snow.
At the time, the perception was that the March 2003 storm was very well forecast, far in advance of the storm. (State climatologist emeritus Nolan Doesken confirms this perception.) The forecasts of the March 2021 “Pi Day” storm also got plenty of attention at the time, and with another potentially big snowstorm on the way for the Front Range this week, let’s take a look at how far forecasting has come in the 21 years since the March 2003 storm.
Predictions of the March 2003 storm
Compared to what’s available today, the information available to forecasters in 2003 was pretty limited. The US essentially ran two numerical weather prediction models: an earlier version of the Global Forecast System (GFS), and the Eta model (predecessor to today’s North American Mesoscale (NAM) model). Ensemble forecasting was still a relatively new concept and not in wide use (more on this in a bit). Reading through National Weather Service forecast discussions leading up to the storm, the guidance from these two models was clearly what forecasters were relying on. Forecasts from the GFS are archived and accessible, but I wasn’t able to find an archive of the Eta model output (except for shorter-range forecasts). Here’s what the GFS liquid precipitation forecasts looked like for the 5 days leading up to the storm, with the observations in the lower right.
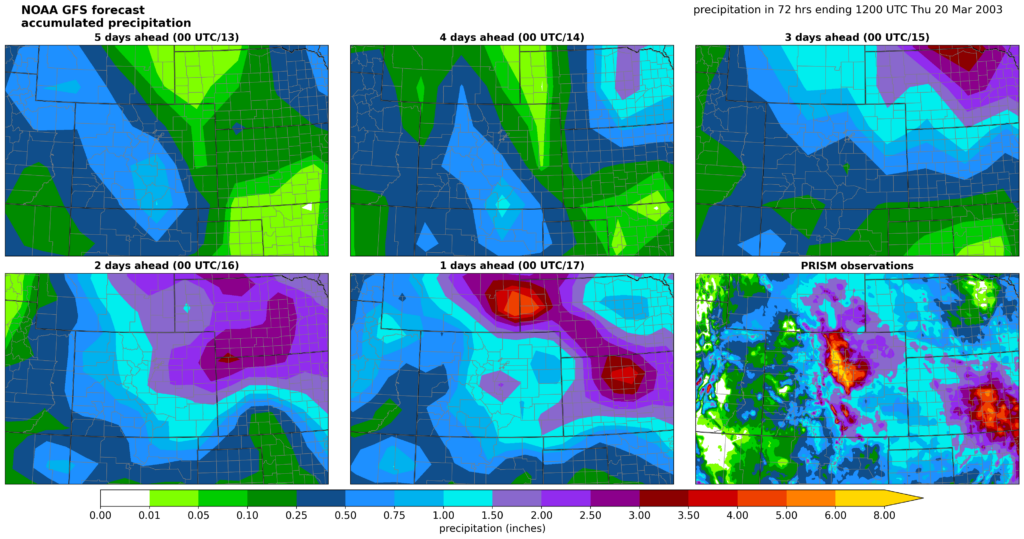
These actually don’t look very good. Part of that is the coarse resolution of the model that was available at the time, so details are washed out. But part of it is that the heaviest precipitation wasn’t really predicted in the right place! There’s a signal for substantial precipitation, but it jumps from southern Colorado to Wyoming and never really locks in very well on northern Colorado. There’s also nowhere near the over 6 inches of liquid precipitation (!) that fell in the Front Range foothills.
Fortunately, NWS forecasters are experts at what they do, and they use knowledge of meteorology rather than just what the models are showing. And this knowledge was critical in identifying what was likely to happen. Here are some quotes from the NWS area forecast discussions leading up to the storm:
| Approximate time before snow started | Selected text from NWS area forecast discussion |
| ~5 days | IF MODELS DO VERIFY…WE COULD SEE A SIGNIFICANT STORM ALONG THE FRONT RANGE EASTWARD INTO NORTHEASTERN COLORADO MONDAY NIGHT INTO TUESDAY. CONDITIONS MAY IMPROVE ON WEDNESDAY. AT THIS TIME WILL KEEP POPS AT A CHANCE AS WE ARE STILL OUT SOME 156 HOURS. |
| ~4 days | BEST BET LOOKS LIKE THE BEST STUFF WILL BE SOUTH OF US…THOUGH IT COULD STILL BE CLOSE ENOUGH TO GET GOOD SNOW ALONG THE FOOTHILLS NEAR DENVER. |
| ~3 days | NOW FOR THE TROUBLE. ETA SHOWS A PRETTY WELL ORGANIZED CYCLONE DEVELOPING OVER SERN CO SUN NIGHT AND PARKING THERE FOR ETERNITY… MEANWHILE CONSENSUS OF THE OTHER MEDIUM RANGE MODELS HAS BEEN A STRONGER AND SLOWER SOUTHERN SYSTEM…PERHAPS EVEN TOO FAR SOUTH TO BE GOOD FOR US. |
| ~2 days | MODELS ARE COMING INTO BETTER AGREEMENT ON THE DEVELOPMENT OF A MAJOR WINTER STORM MON THROUGH WED…MODELS DEPICT FRIGHTFUL SNOW AMOUNTS…15 TO 20 INCHES FROM THE AVN ON THE PLAINS FROM MON NIGHT THROUGH WED NIGHT. ETA HAS HEAVIER AMOUNTS WITH 12 TO 18 INCHES ALONG THE FRONT RANGE BY TUE AFTERNOON IN THE MIDDLE OF THE EVENT. |
| ~1.5 days | THERE IS GREAT POTENTIAL IN THIS STORM TO PRODUCE THE BIGGEST PLAINS SNOWSTORM SINCE THE OCTOBER BLIZZARD OF 97…IF ALL THE PIECES COME TOGETHER AT THE RIGHT TIME…RIGHT PLACE…AND RIGHT INTENSITY. |
| ~1 day | CONFIDENCE INCREASING ON A BIG SNOW STORM… PERHAPS REALLY BIG…THE AVN GIVES STORM TOTALS OF 15 TO 20 INCHES FROM CHEYENNE TO DENVER AND OUT TO LIMON. THE ETA … SHOWS 35 TO 45 INCHES IN DENVER WITH 8 TO 20 INCHES ON THE MIDDLE PLAINS AND JUST AN INCH IN THE NE CORNER….FOOTHILLS WILL GO NUTS ON WED IF THE ETA IS RIGHT. |
| start of event | INGREDIENTS ARE ALL COMING TOGETHER FOR SIGNIFICANT SNOW EVENT WHICH WL CONT FOR THE NEXT COUPLE DAYS…FORECAST STORM TOTAL SNOW ACCUMULATIONS FROM THE MODELS ARE HOLDING STEADY…ETA HAS 30 TO 40 INCHES FOR DENVER…GFS IS HOLDING STEADY WITH 15 TO 20 INCHES…. ETA GENERATES A BAND OF 80 INCHES OF SNOW IN THE HIGHER FOOTHILLS… SNOW MODEL GIVES INCH PER HOUR RATES FROM NOW THROUGH WED NIGHT. THE 5 FOOT LIMIT IN THE FOOTHILLS DOES NOT APPEAR TO BE ENOUGH. I WILL TRY 3 TO 8 FEET BUT THERE COULD BE SOME PRIME SPOTS THAT GET EVEN MORE. I SUPPOSE THERES NO DIFFERENCE EXCEPT FOR THE RECORD BOOKS. |
As of about 2 days before the start of the storm, this was a very accurate description of what would happen, especially for 2003 standards. But more than 3 days in advance, there wasn’t much useful information beyond the idea that a storm was possible.
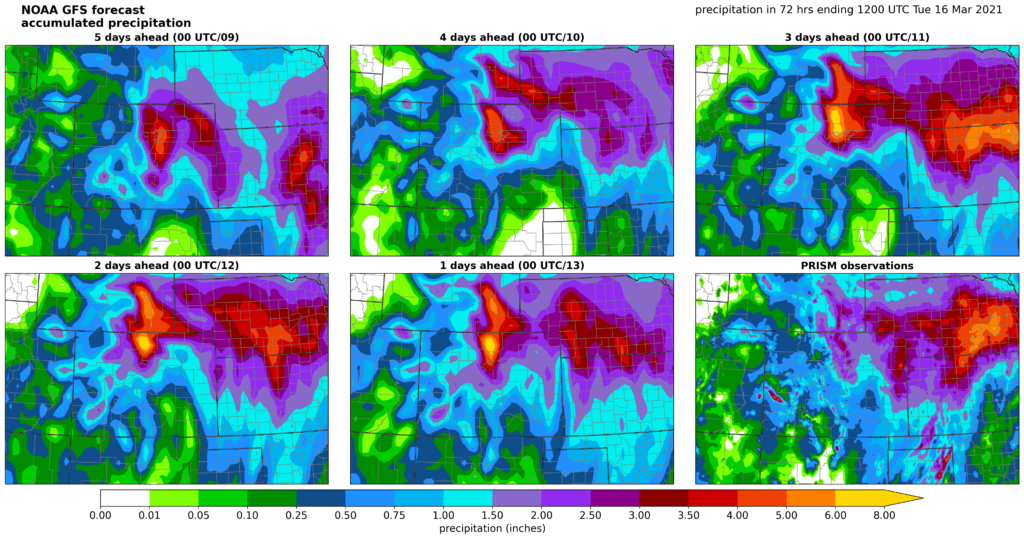
We can compare the graphic above to a similar one for the March 2021 Pi Day storm. For that storm, the GFS forecasts were remarkably consistent from 5 days in advance to when the event started. They all had the heaviest precipitation along the northern Front Range and southern Wyoming, extending out into Nebraska, and that’s what happened. The primary issue with these model runs is that some of them over-predicted the precipitation. So even though there was uncertainty in the details, the fact that there would be a big storm on the northern Front Range was quite clear at least 5 days in advance, which is a big improvement over what was possible in March 2003.
A big advance: ensemble forecasting
Today, a critical tool in the forecasting toolbox is “ensemble” forecasting, whereby many different model forecasts are made, using slight tweaks to the initial estimate of the state of the atmosphere, or different assumptions about processes like cloud microphysics, or both. This ideally provides a range of possible outcomes, and allows forecasters to highlight “worst case” and “best case” scenarios. Here’s an example of an ensemble “plume” for the big Pi Day storm in March 2021:
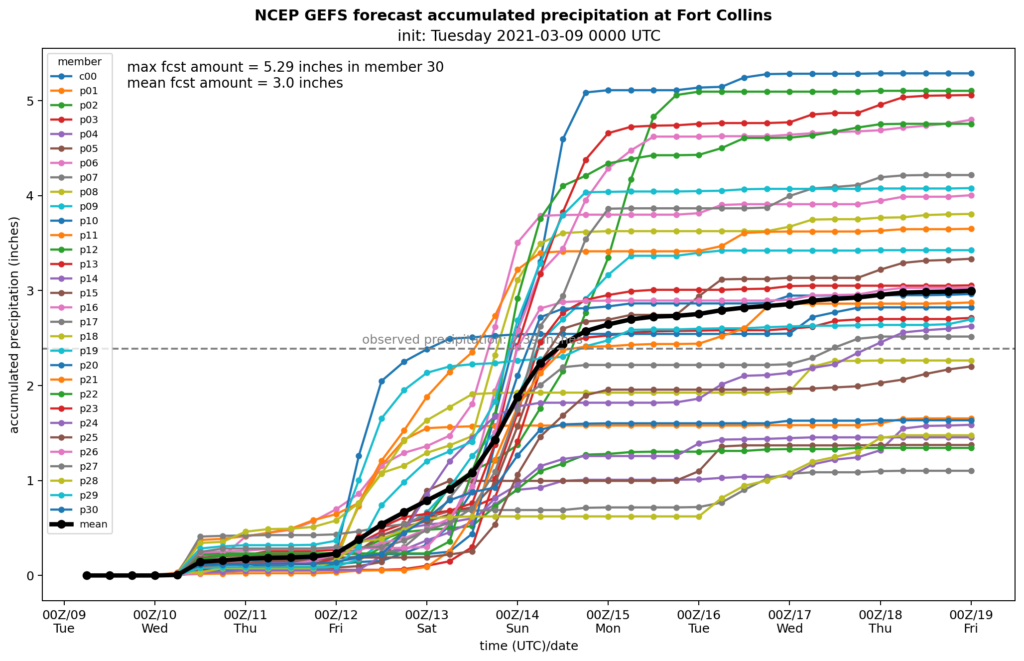
This forecast was made around 4 days in advance, and again, it’s pretty clear that a big storm is on the way. But was also still a wide range of possible outcomes — from lower-end amounts (around an inch of liquid) to some extreme amounts (5+ inches). The mean (thick black line) was a little over 2.5″ for this forecast, and turned out to be quite close to what happened (Fort Collins recorded 2.39″ of liquid in this storm.) This signal continued as the storm neared, and the NWS issued this remarkably good forecast early on March 12th (backed up by insightful discussions of the meteorology behind the forecast):

Sure, you can find some details to quibble with (Fort Morgan got more snow than the forecast, while parts of El Paso County got less), but the overall pattern was right on. This level of detail also goes far beyond what was possible in March 2003. NWS now routinely provides the “best case” and “worst case” scenarios, along with probabilities of exceeding certain snow amounts.
Still really difficult: rain vs. snow, details, and bands
You might notice that I mostly showed model depictions of liquid precipitation rather than snowfall. Figuring out the changeover from rain to snow, and what the snow-liquid ratio will be, are big challenges that remain in snowfall forecasting. Think of it this way: on most days, you probably don’t care if the temperature forecast is off by a couple degrees. If the forecast is 70 and it ends up being 68 or 72, no big deal. But when those couple degrees surround 32F, it can be the difference between a huge snowstorm or a miserable cold rain. The complex terrain in Colorado complicates this further, because temperature can change rapidly with small changes in elevation. This is one of the big questions about the incoming storm on the eastern plains: there’s been a slam-dunk signal for a lot of liquid for nearly a week, but will it be cold enough for significant snow to accumulate? We shall see…

Another big challenge is when the snow is arranged in “bands”. These bands can cause big snow totals in very localized areas, while nearby spots get next to nothing. One recent example was the 10+” of snow that fell around Greeley on February 9-10, 2024. These are really hard to predict, and when there is a “busted” forecast, it’s often because of these snowbands.
What’s also changed: dissemination of information
The other big change over the last 21 years is how information is communicated. TV meteorologists and newspapers still play an important role in getting the word out, but many people get their weather information from a smartphone app or social media. Most of us have internet-connected computers in our pockets, which makes it much easier to find credible forecast information, if you know where to look.1 But on the other hand, the potential for “hype” ahead of a potential big storm is much greater, as is the criticism that forecasters receive if the predicted totals aren’t right on. (Forecasters don’t ever seem to get equivalent praise for getting it right…)
The improvement in weather prediction over time has been called a “quiet revolution.” No single discovery or advance has led to these improvements, but instead the incremental increase in knowledge, data, and computing power. The forecasts of the March 2003 snowstorm by human forecasters were indeed very good for the time (the computer model output itself, maybe not so great.) But today, although snow forecasting remains difficult, it’s usually possible to see what’s coming a lot farther in advance, and with a lot greater detail.
For further reading
If interested in more reading on Front Range snowstorms:
- NWS Probabilistic Winter Snow forecasts. Link is https://www.weather.gov/bou/winter for the Boulder office, change “bou” to “pub”, “gjt”, or “gld” for the other offices serving Colorado.
- “Extreme Snowfall Variations and Cold-Air Damming in the Front Range Heavy Snowstorm of 17-19 March 2003” by Doug Wesley et al. http://nwafiles.nwas.org/jom/articles/2013/2013-JOM4/2013-JOM4.pdf
- “Barrier Jet Forecasting: Eastern Foothills and High Plains of Colorado 17-20 March 2003”. UCAR COMET MetEd. https://www.meted.ucar.edu/education_training/lesson/210
- “The “Pi Day” Storm of March 2021 and the start of drought relief in eastern Colorado,” by Russ Schumacher. Colorado Water, Newsletter of the Water Center of Colorado State University. https://watercenter.colostate.edu/wp-content/uploads/sites/33/2021/11/ColoradoWater_V38-2-references-r14-lr.pdf#page=35
- Our previous posts on where to get snow information and how Front Range winter precipitation has and hasn’t been changing.
- My own story from March 2003: my girlfriend at the time (now wife) and I had been in Florida for spring break, flying back to Colorado the evening of March 17. Despite the good forecasts noted above, we had no idea about the incoming snowstorm, because people weren’t just on the internet all the time. That wouldn’t happen today! We made a harrowing drive back to Fort Collins just as rain was changing over to snow, but it turns out that if we hadn’t driven back that night we would’ve been stuck at the airport for multiple days. ↩︎