


There hasn’t been much cold weather to speak of so far this winter in Colorado. [In case you missed it, here’s last week’s post with a look at those numbers, which are pretty bleak if you like winter.] But do you remember what happened at this time in December of 2022? If you’re reading this, you surely know that the temperature in Colorado can change in a hurry. But three years ago, the temperature changed in a hurry. It went from above freezing to below zero Fahrenheit in just a few hours, and observations of the temperature dropping over 30°F in an hour were commonplace. Even in a place where we regularly experience strong cold fronts, it was clear that this cold front was extreme. So, working with students from my mesoscale meteorology class the next spring—Charles Davis, Mitchell Gregg, and Megan Franke, along with Allie Mazurek who now works with us at the Climate Center—we set out to determine just how extreme. The results were published in the journal Monthly Weather Review1 earlier this year. Some of the especially interesting parts are summarized below.
As shown in the animation above, on the afternoon of December 21, 2022, the cold front quickly moved southward through eastern Wyoming and western Nebraska, and then swept across Colorado’s eastern Plains. Early in the day, winds were out of the west, meaning that there was warming from downslope flow across the mountains, so temperatures along the Front Range were in the 40s and 50s. As the cold front moved through, temperatures dropped very rapidly, and blowing dust was observed in some places. Temperatures were below zero by early evening, along with strong winds, snowfall, and extremely low wind chills. The cold air stayed in place for a couple days, with high temperatures on the 22nd staying below zero in much of northeast Colorado.
The animation below provides another way to visualize the passage of the front as it swept across the plains. It shows the temperature traces from eastern Colorado CoAgMET stations, with the rise in temperature in the morning and early afternoon, followed by the rapid crash when the front passed. The ones with early temperature drops are in northern Colorado, with a progression toward stations farther south, and the gray line that hangs on for several hours after the others is at Westcliffe in the Wet Mountain valley.
What were some of the observed temperature changes?
First, we’ll look at how quickly the temperature dropped at weather stations in the network operated by the National Weather Service as well as the CoAgMET network. Some of the NWS stations report temperature every minute, while others report every 5 or 15 minutes, and nearly all CoAgMET stations report every 5 minutes. Here are the largest temperature drops we found over various time spans (here in Fahrenheit; in the paper they are given in Celsius).
- 31 degrees in 5 minutes at the Cheyenne, Wyoming airport
- 41 degrees in 30 minutes at Greeley (CoAgMET station GLY04)
- 46.2 degrees in 60 minutes at Greeley (CoAgMET station GLY04)
- 62 degrees in 12 hours at Denver International Airport
Yes, you are reading those numbers right. At Greeley, it was 50.9°F at 2:40pm, and 30 minutes later at 3:10pm it was 9.9°F. And as we went through as much past weather data as we could find, we couldn’t identify any other cold fronts that matched these kinds of rapid temperature changes. At six of the eight stations shown below, all of which have data for 25 years or more, it was the fastest 3-hour temperature drop on record, and at several of them by a large margin. Similar results were found if looking at different time spans (6 hrs, 12 hrs, etc.) We even compared the temperature changes in this front to other strong cold fronts that have been analyzed in the meteorological literature, and the temperature drops in this one were faster than all of them. This really was an extreme cold front!
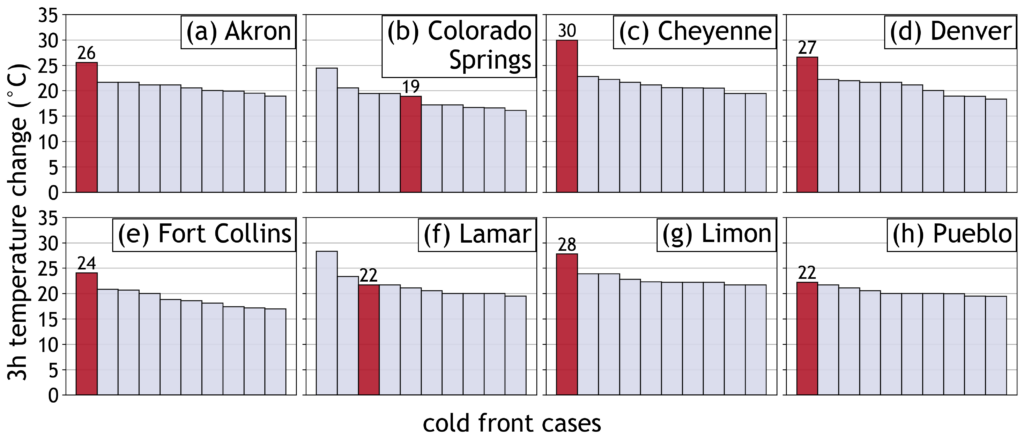
Top ten 3-h temperature changes (in Celsius) between October and May at (a) AKO, (b) COS, (c) CYS, (d) DEN, (e) fcc01, (f) LAA,
(g) LIC, and (h) PUB. The red bar represents the observed 3-h temperature change associated with the December 2022 cold front at each station. Only observations since 1986 (through 2023) are considered, though not all stations have records dating back that far.
Is it possible to measure the temperature change over even shorter time periods?
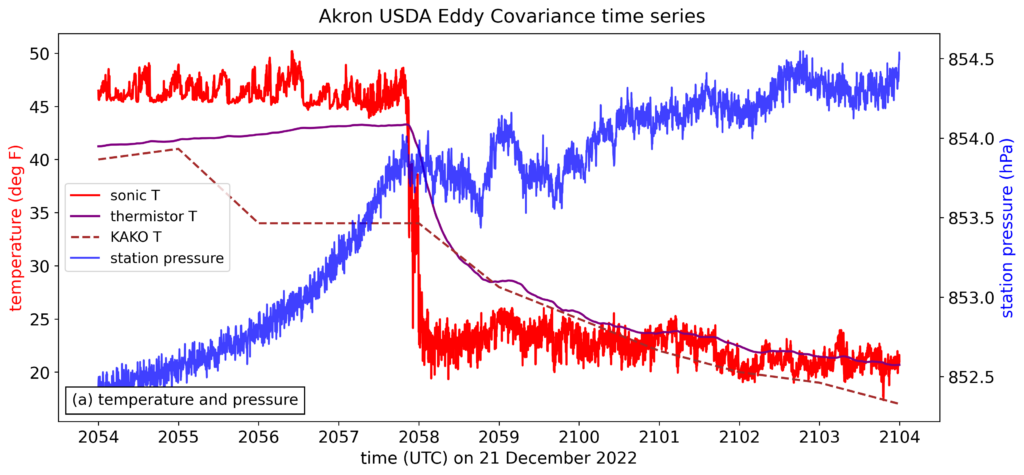
Usually when even strong cold fronts pass through, you might feel the wind shift and the temperature change over the course of minutes or an hour. But when the December 2022 cold front arrived, you could feel the change almost instantaneously. And it turns out that colleagues at the US Department of Agriculture’s research facility in Akron, Colorado, have equipment that can measure the temperature even more quickly. This instrumentation, known as an eddy covariance tower, is usually used to measure the rapid, but small, fluctuations in temperature and moisture associated with turbulence. (Think of what you feel when the wind gets a little gusty on a summer afternoon.) But here we wondered what temperature measurements 10 times per second would look like for an extreme cold-frontal passage.
The results were pretty remarkable. The graph above only covers a time period of 10 minutes. The data show that the temperature dropped 14°F in one second, and nearly 25°F in ten seconds! From talking with experts in measurements, the sonic thermometers used in eddy covariance measurements should be able to accurately measure such rapid changes, whereas standard thermometers used in weather stations respond more slowly. Showing that the temperature was dropping on the order of seconds in this cold front was a pretty cool (pun intended) result.
How well was this front predicted?
A few days in advance, it was clear that a strong cold front was going to pass through on the 21st, and that it would be out of the ordinary. For example, on December 18, the NWS in Cheyenne wrote,
“it stands to reason that this is a highly anomalous air mass w/potential for numerous records, and serious cold-related impacts for both livestock and human society w/fatalities not out of the question, especially for more vulnerable populations…If you do not have a reason to be outside on Wed night or Thursday morning, PLEASE remain indoors.”
Confidence only increased in the forecast as the front approached, though forecast models did end up predicting the front to pass a bit later than it actually did.
In the past few years, weather prediction models that use machine learning rather than solving physical equations have received a lot of attention. They have been shown to forecast large-scale weather patterns better than traditional models across many metrics. However, there are still a lot of questions about their skill in predicting extreme events. And as we’ve seen, this was a very extreme event, so we wanted to take a look at how the ML models did.
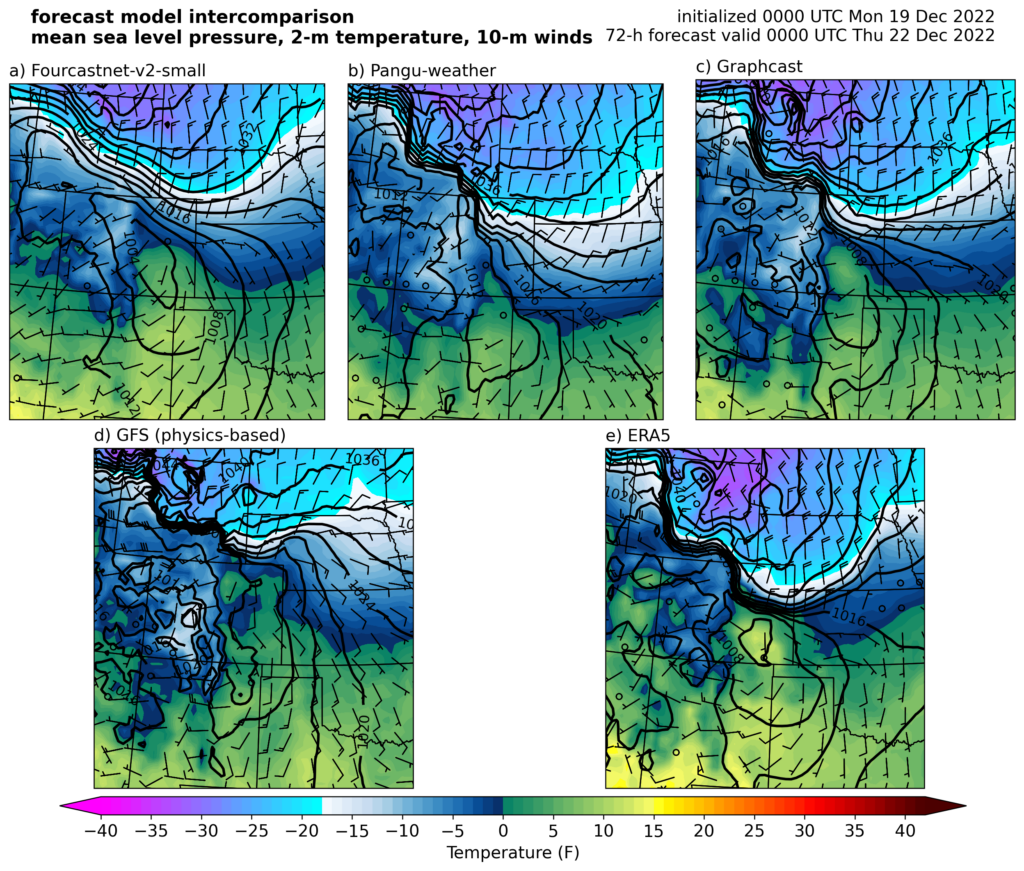
In the figure below, the top row shows forecasts from three machine learning models, 3 days before the front passed through. The lower left is the US flagship GFS model, and the lower right is the “truth” from reanalysis. Some of the ML model forecasts are too smooth (FourCastNet), or have strange-looking variations (Pangu-Weather). But they all predicted the cold front to be in northern Colorado by the evening of December 21. In contrast, the physics-based GFS model had a more realistic depiction of how intense the front would be — but the front was predicted to still be in Wyoming and Nebraska, rather than plunging through eastern Colorado. In general, we found that the Graphcast machine-learning model got the right timing and location of the frontal passage about a day sooner than traditional models.
This seems to be a theme with this new generation of models: they don’t always represent the details of how the atmosphere works in a faithful way, but if what you care about most is an accurate forecast, they are very good, and continuing to get better.
This post is already very long, but if you’re interested in even more aspects of this event, the paper has even more on the climatological context, the forecasts, and a high-resolution model simulation of the front.
In summary, the cold front of late December 2022 was remarkable for a number of reasons, and it provided an opportunity for some students and me to geek out on various aspects of it, and add to the understanding of high-impact weather in the process. We’ll keep our fingers crossed for a pattern change that brings anything other than “unusually warm” to the forecast as we head into 2026. I hope everyone has happy holidays and a happy new year!
- If you are unable to access the paper through the journal website and would like a copy, just send me an email and I’m happy to share the PDF. ↩︎