|
|
Drought Early Warning System June 30, 2020 |
|
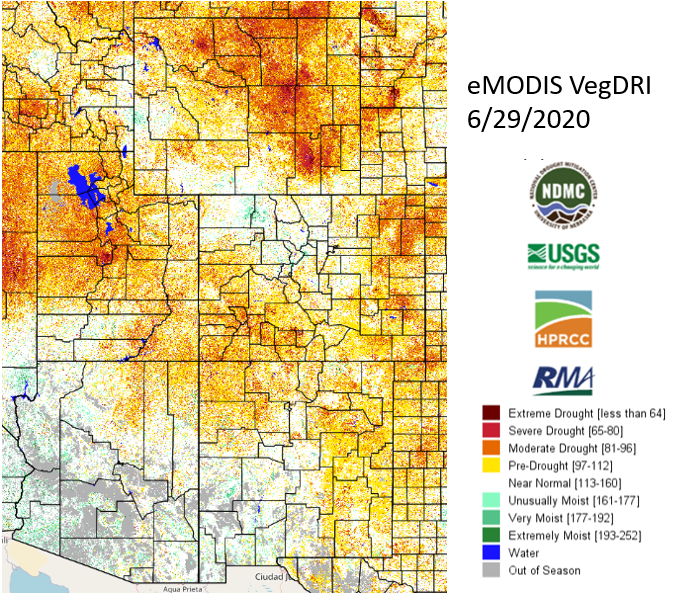
Soils and Vegetation ![]()
Soil moisture map shows VIC modeled soil moisture, provided by University of Washington, updated daily.
VegDRI is a satellite-derived product that depicts how vegetation is responding to drought/climatic conditions. Product is provided by the United States Geological Survey and is typically updated every Monday.
Reservoir Supplies ![]()
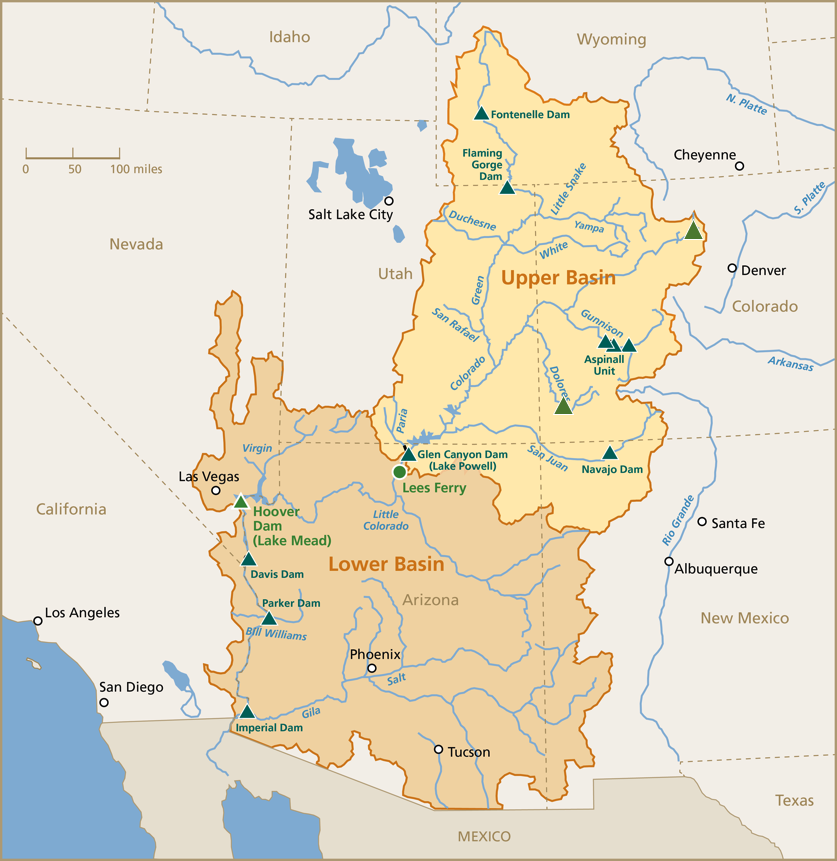 Click on the map above to see graphs, produced by the Colorado Climate Center, for some reservoirs in the Upper Colorado River Basin.
Data provided by the U.S. Bureau of Reclamation, and graphs are typically updated every Monday.
The dashed line at the top of each graphic indicates the reservoir's capacity, and the background color-coded shading provides context for the range of reservoir levels observed over the past 30 years.
Dead storage has been removed. Note: Lake Granby data are obtained from the Colorado Division of Water Resources and goes back to the year 2000.
Click on the map above to see graphs, produced by the Colorado Climate Center, for some reservoirs in the Upper Colorado River Basin.
Data provided by the U.S. Bureau of Reclamation, and graphs are typically updated every Monday.
The dashed line at the top of each graphic indicates the reservoir's capacity, and the background color-coded shading provides context for the range of reservoir levels observed over the past 30 years.
Dead storage has been removed. Note: Lake Granby data are obtained from the Colorado Division of Water Resources and goes back to the year 2000.