It’s the beginning of April, which signifies the beginning of the end of our snowpack season. In Colorado, our southern basins typically reach their peak snowpack in the next few days, while our northern basins still have a few more weeks to go. But by this time, we usually have a pretty good idea on how we fared this season and what our water situation might look like as we approach the summer. So let’s take a look!

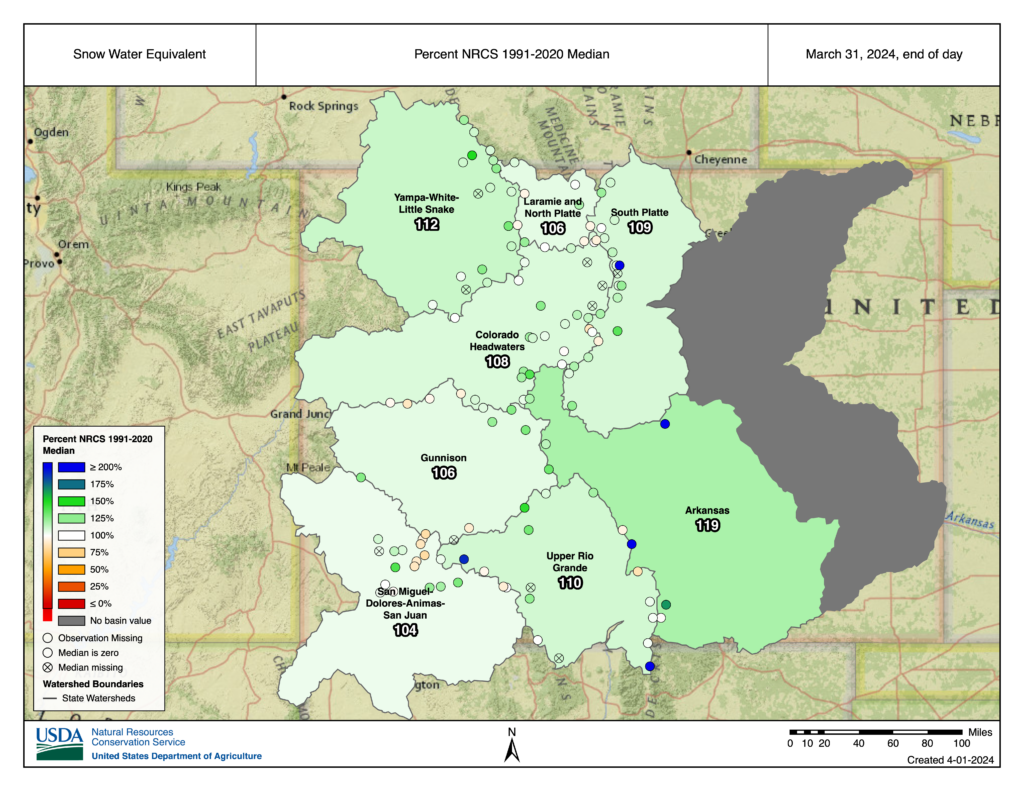
At the end of March, all Colorado basins reported above median snowpack. The Arkansas basin is at the highest, with 119% of median, and the San Juan basin in southwest CO is at the lowest, with 104% of median. Despite the basin averages. there are a few individual SNOTEL sites that are a bit below average. A few sites around the San Juan mountains are showing lower snowpack, as is Park Reservoir on the Grand Mesa.

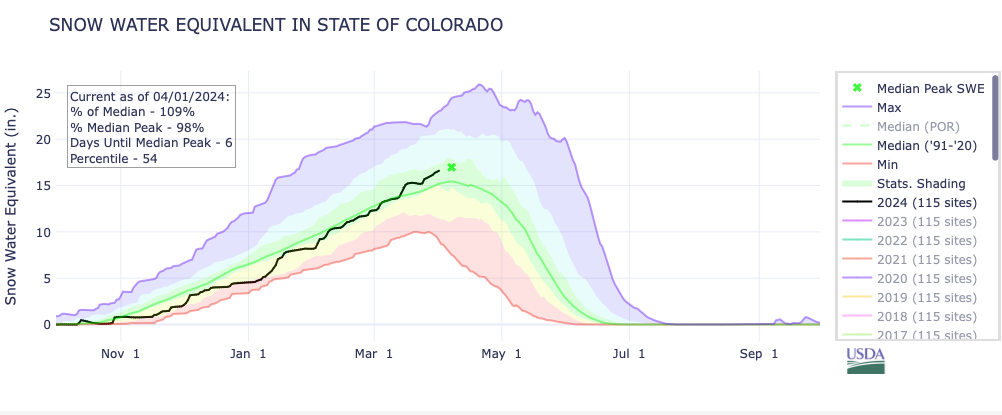
The above graph shows how the snowpack has accumulated since the beginning of October, following the black line. The green line indicates what’s typical, and the “X” shows the normal peak date and value. For the statewide average, we’re six days away from the peak, and well on target to reach and possibly exceed that normal peak.
So, what happens after we reach peak?
It’s easy to forget, but passing the peak does not mean it stops snowing. In fact, it’s very important that snow continue to accumulate in the high elevations well into May! It’s hard to tease out from the snowpack graphs (like the one above) that new snow is being added on, even in the midst of overall melting. The peak really means the mountains have hit a critical time when solar radiation, and the higher angle of the sun, are having a greater impact on the snow surface. Snowpack becomes isothermal (meaning consistent temperature of 32°F throughout the entire depth), and melting takes over.

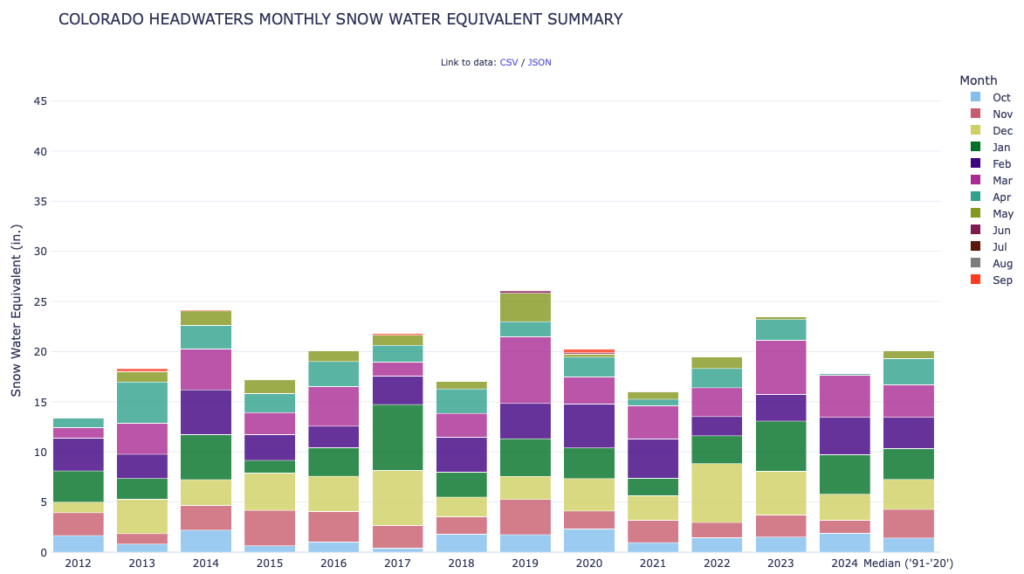
The graphic above is a pretty cool product produced by the NRCS. Focusing in on the Colorado Headwaters region here, we’re looking at the total amount of snowpack that accumulates in each individual month for water years back to 2012. The stacked graph on the right shows the median (what is typically expected). Next to that is how the current water year is stacking up. The magenta color is March snowpack. You can see this year is a bit ahead of the median, but behind what we had last year. The teal and green colors are yet to stack up for April and May. For just April and May, we normally add 3.4″ of new snowpack. Water Years 2013 and 2019 are examples of when we got much more than that in April and May.
Now look more closely at Water Years 2012 and 2021. In 2012 snowpack lagged behind for most of the winter. And there was barely any accumulations in March and April, resulting in near record low snowpack for many areas, including the Colorado headwaters. In 2021, accumulations were a little behind at the end of March, but not too far off. Unfortunately, very low snowpack numbers in April and May resulted in much below average total snowpack and contributed to worsening drought conditions.
While our 7-day outlook for precipitation shows more activity over the mountains, mid-April is looking more likely to be warm and dry. If we pick up normal accumulations as the melt starts this spring, our snowpack season will end in decent shape. Areas that miss out on new accumulations and start a rapid melt may find their situation a bit more concerning at the beginning of summer. We’ll see how it all unfolds soon!
If you are interesting in exploring the interactive graphics provided by the NRCS – and used for this blog – check out the NRCS Colorado Snow Survey page.


