


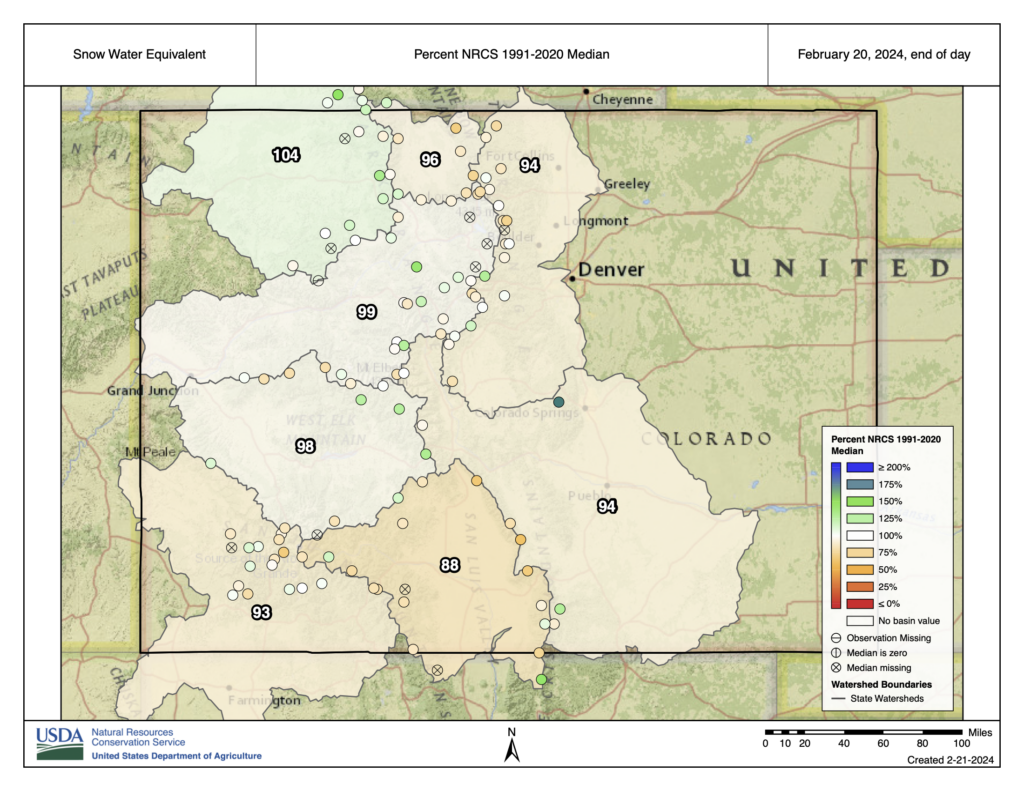
We spend a lot of time thinking about snow in our mountains, because Colorado is a headwaters state, and the water stored in that snowpack ends up serving ecosystems, farms, and millions of people not just in Colorado but in all directions. As we progress toward the end of February, the overall picture of Colorado’s mountain snowpack comes into much clearer focus. As of February 20th, the snow water equivalent (SWE) in Colorado’s mountains, as measured at SNOTEL stations, was 97% of the median value for this day, compared to the 1991-2020 period. The northern mountains were a little bit above average (for example, the Yampa-White basin was at 104% of average), and the southern mountains a bit below (88% of median for the mountain areas feeding the Rio Grande river).
The state of the snowpack at this point in the winter can be characterized as pretty ok. Certainly much better than some of the drought years over recent decades, but also nowhere near the huge snows that fell last year across Colorado. (At this time last year, we were sitting at about 120% of average statewide.)
The snow accumulation season started quite slow: most locations were lagging well behind the average snowpack, with a few sites near record lows, in early January. But then a major storm cycle in mid-January gave a huge boost to the snowpack, bringing it back within shouting distance of the average. February has been a more typical month in the mountains, with a steady string of storms, some hitting the northern ranges and others benefiting the south. That brings us to the decent position we’re in now: not amazing, but not too bad either.
How much do the current conditions tell us about where we’ll end up?
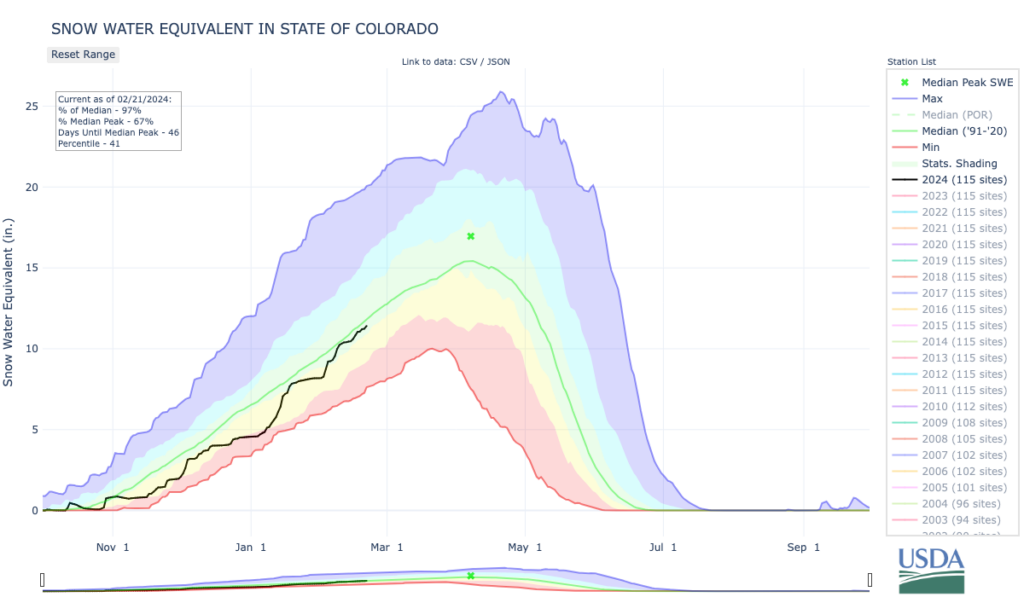
It turns out that for the statewide average, the snowpack value on February 20th correlates very strongly with the eventual peak, as shown in the graph below. (The correlation coefficient is 0.85, for those familiar with that metric.) In past years when the snowpack was similar in late February to where it is this year, the eventual peak tended to be a little below average. Only one year when the February snowpack was similar to this year did the seasonal peak end up well above average (1998…more on that in a second.) There’s still about a month and a half until the typical peak (a little less in the south, more in the north), meaning there’s still time for things to change. In a typical year, a whole lot of snow falls between late February and mid-April! But it’s also uncommon for a huge change in the overall seasonal picture after this time in the winter.

So, what should we expect for the rest of the winter and spring? Although snowpack is just a bit below average, the water supply forecasts for the Upper Colorado River Basin look even lower. The Colorado Basin River Forecast Center’s mid-February update projected that April-July streamflow into Blue Mesa Reservoir along the Gunnison River will be 88% of average. For this reservoir—Colorado’s largest—that would be a decent outcome. However, the projected flow into Lake Powell is only 77% of average. Lake Powell rose above its historic lows after the big snows last year, but is still far below average levels (let alone being filled.)
There are a couple of wild cards to consider. One is that we remain in El Niño conditions, which tends to increase the odds of a wet and snowy spring (see Figure 2.12 here). Recall the reference above to 1998, when snowpack that was just ok in February ended up well above average by late April. That was a strong El Niño similar to this year. The CPC monthly outlook for March does tilt toward wetter-than-average conditions, so that is a possible reason for hope.
On the flip side, the long-term trend toward warm springs and earlier melts in the mountains continues as the climate warms, which could alter the eventual water supply as well. As pointed out in this post, the biggest reason for errors in streamflow forecasts is the fact that we don’t know what’s going to happen with the weather over the next couple months! So, while history and these outlooks give some useful hints, as usual we will just need to wait and see what happens.